




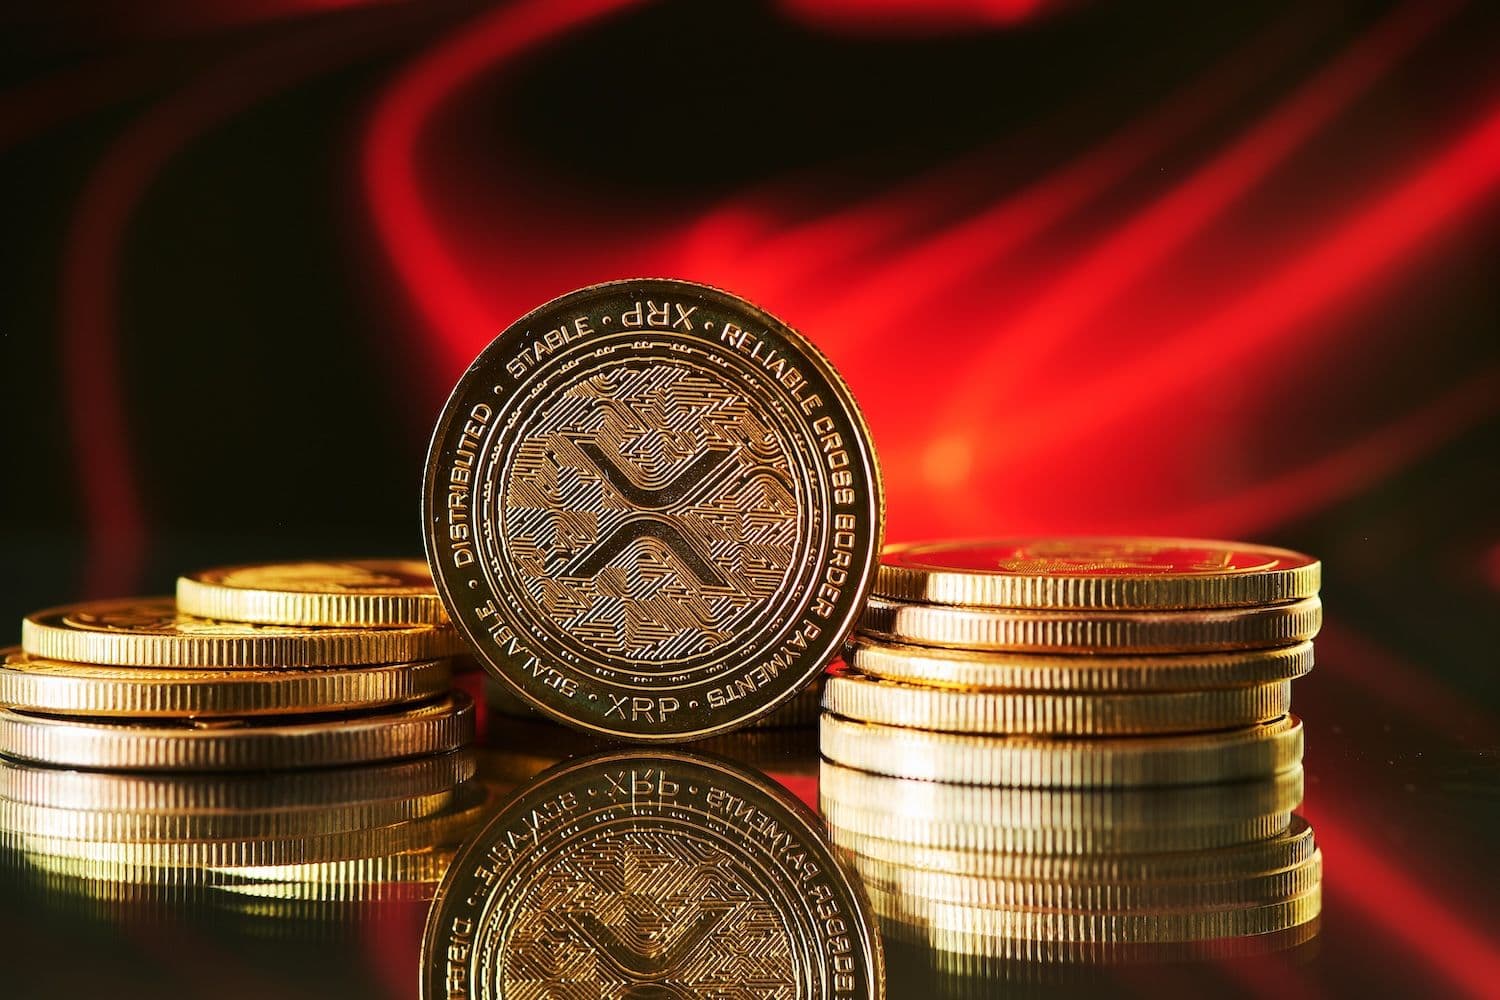
XRP (XRP) supply available for sale on Binance has dropped to its lowest level since 2024, with the platform's scarcity indicator reaching 0.59, according to an Arab Chain report — a reading that historically preceded stronger price action even as the token trades near $1.35 amid a prolonged downtrend.
XRP Binance Scarcity
The scarcity indicator tracked by Arab Chain measures how much XRP remains available for immediate sale on Binance. A reading of 0.59 marks a multi-year high.
The metric spent months in deeply negative territory during periods of peak selling pressure and heavy exchange inflows earlier in the cycle.
Its move into positive territory reflects a shift in holder behavior.
Coins are leaving the exchange. Investors are withdrawing XRP to private wallets, locking positions for the longer term and removing liquidity from the market's most accessible selling venue.
Also Read: A US Senator Is Questioning the SEC — And The Justin Sun Case Is At The Center
Accumulation Phase Signals
The data suggests short-term sellers who dominated earlier in the cycle are being replaced by long-term holders. These participants are accumulating quietly and pulling coins off exchanges.
In market structure analysis, this pattern is called an accumulation phase.
The scarcity index reaching a multi-year high is one of its clearest on-chain signatures.
The report notes two conditions must hold for the thesis to play out. Overall market sentiment needs to keep improving, and exchange supply must continue to contract. If both persist, the setup for a stronger price move builds gradually.
XRP Price Structure
XRP traded at $1.3510, up 1.75% on the day. The token peaked near $3.90 in late Jul. 2025 and has traced a descending pattern of lower highs since then.
The 50-day moving average has crossed below the 100-day — a bearish signal on the intermediate timeframe.
The 200-day moving average sits near $2.10, far above current levels.
A daily close above $1.45 would be needed to suggest the post-capitulation range is forming a base rather than a continuation pattern toward lower prices. The Feb. capitulation wick to $1.15, accompanied by the heaviest sell volume on the chart, established the floor currently being tested.
Read Next: Solana's Correction To $50 May Fuel Next Big Rally