


加密貨幣市場全年無休,每天都有數十億美元在數位交易所中流動。無論你是剛入門還是想精進交易技能,本新手指南都會帶領你了解閱讀加密幣圖表與利用技術分析 (TA) 做出明智決策的基礎。學會如何閱讀加密貨幣圖表,是每位交易者或投資人在這個領域中必備的基本能力之一。
可以把加密貨幣圖表比喻為金融市場中風暴與陽光的氣象圖。就像氣象學家用各種大氣數據預測天氣一樣,幣圈交易者則利用價格圖預測潛在市場走勢。唯一的不同在於,決策的結果不再只是攜帶雨傘與否,而是有可能對你的財務未來產生重大影響。
技術分析的基礎
技術分析(Technical Analysis, TA)是一種透過分析加密貨幣價格數據,來辨識型態與趨勢的方法。有別於研究新聞、監管動向和專案基本面等外部因素的基本面分析,技術分析完全關注於價格過去的表現和成交量數據。這種方法建基於三個核心原則,指引交易者超過一世紀。
第一個原則認為市場價格已反映所有可用信息。當比特幣價格從6萬美元漲到6.5萬美元時,這個漲幅理論上便涵蓋了所有相關新聞、每一位交易者的情緒,以及影響資產的所有基本面因素。第二個原則指出,價格會遵循趨勢運動,而非隨機波動。這些趨勢可能持續幾天、幾週甚至幾個月,對能早期辨識的人來說就創造出交易機會。第三個原則則認為歷史總是會重演,尤其是在人性心理與市場行為模式上。
這種方法在加密貨幣交易中特別重要,因為它能幫助投資人辨識趨勢、型態與潛在的買入或賣出訊號。加密貨幣市場24小時運作,不像傳統股票市場有明確開盤收盤,傳統的新聞周期也不適用,因此技術分析尤其有價值。
了解圖表類型與時間框架
在深入複雜的型態或指標前,首先你要認識圖表分析的基本架構。加密貨幣交易所通常提供多種圖表類型,每種圖表都會以不同形式展示價格資訊,並滿足不同的分析需求。
折線圖是最簡單的價格可視化方式,用一條連續曲線連接各時段的收盤價。雖然折線圖能簡潔地呈現整體價格走向,但會省略開盤價、當日最高最低價及日內波動等重要細節。這類圖表適合抓大方向,但對於精確進出場時機的把握相當有限。
棒線圖則提供更完整的資訊,會標示每個時段的開盤、收盤、最高與最低價。每根棒線都有垂直線表示價格範圍,不同方向的小橫線則分別表示開盤和收盤價。棒線圖能呈現全部價格資訊,但視覺上容易顯得複雜,面對波動劇烈的市場時,許多交易者覺得不易快速閱讀。
K線圖則成為多數幣圈交易者的首選。每一根K線能顯示開盤、收盤、最高與最低價,可以選擇不同時段(如分鐘、時、日、週)。K線圖的魅力在於直觀的色彩與獨特形狀,能一眼表達市場情緒和動能資訊。
時間框架選擇會直接影響分析結果與交易風格。短線交易者可能會專注於1分鐘或5分鐘圖,抓取快速價格波動;長線投資者則多關注日線、週線乃至月線,以掌握大趨勢。重點原則是,時間框架越長的圖表,訊號越可靠但訊號次數較少;短時間框架則訊號多但雜訊和假訊號也多。
掌握K線圖基本功
K線圖由特定時段內的開盤、最高、最低、收盤價組成。粗長的長方形稱為「實體」代表開收盤差距,兩端細細的「影線」則代表該時段內的高點與低點。理解這些組成要素,是閱讀市場情緒及預測未來價格走勢的基礎。
K線實體呈現的是開盤價與收盤價的關係。若收盤高於開盤,K線通常會呈現綠色或白色,象徵該時段市場偏多。反之,若收盤價低於開盤價,K線則為紅色或黑色,表示當時賣壓主導。
K線上下延伸的影線(或稱「引線」)則可看出一個時段內的價格波動。上影線長代表該時段買方一度推高價格,但最後遭賣壓打回原位。下影線長則說明賣壓一度將價格打低,但買盤在尾盤奮力拉抬,最終收高。
實體與影線的關係能反映市場方向的信心程度。實體大而影線短,顯示當時市場走勢相當堅定;實體小但上下影線很長時,則代表多空拉鋸、盤整或趨勢即將轉變。若實體很小、上下影線長且幾乎相等,這就稱為「十字線」或「陀螺」,象徵市場猶豫不決。
加密貨幣交易必學的K線型態
K線型態是加密貨幣交易者必備的分析工具,能透過不同時間週期的價格走勢展現市場心理。學會辨認這些型態,能大幅提升進場與出場時機的判斷力。
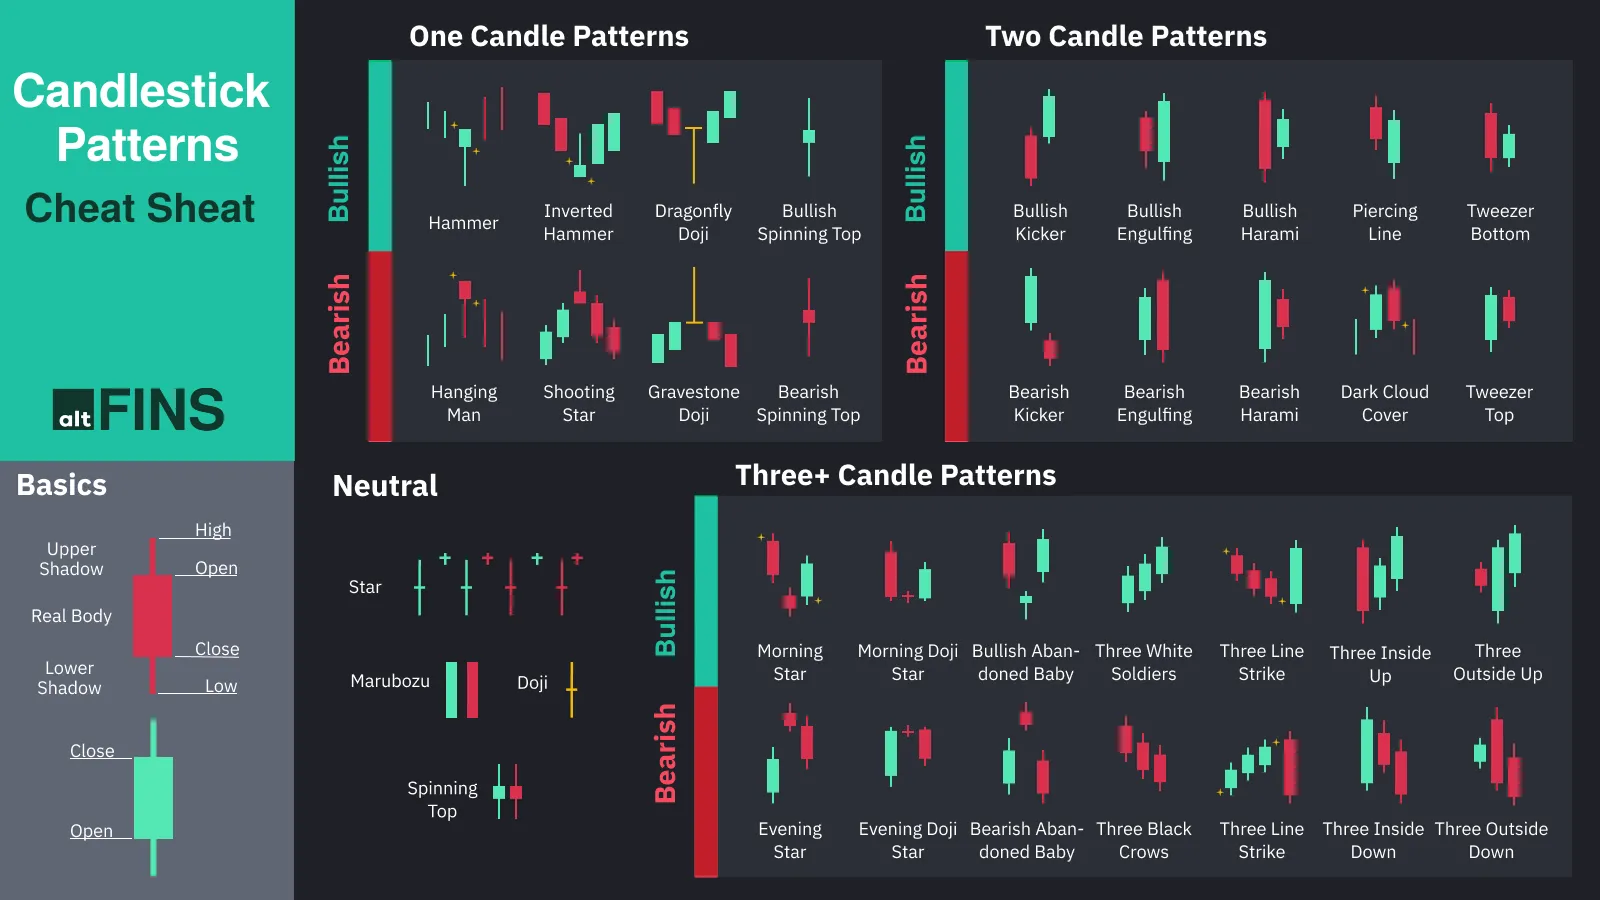
單根K線型態通常最直接明確。最具代表性的「十字線」(Doji),特徵是開盤價與收盤價幾乎相同,象徵市場猶豫。當十字線出現在明顯趨勢之後,常見為趨勢走勢可能轉弱甚至反轉的訊號。
「鎚頭」(Hammer)是加密圖表上常見且重要的反轉型態,為多頭反轉信號。其特徵為下影線長、收盤價高於開盤價,心理層面解釋是,賣壓曾經壓低價格,但買盤在尾盤大舉拉抬,為多頭奠定基礎。
「流星」(Shooting Star)則是鎚頭的空方版本,形狀與倒鎚頭相同,但出現在上漲趨勢中。此型態為短實體、上影線至少為實體兩倍長。這代表買方一度推高價格,但賣方全面反擊,將價格打回起點。
兩根K線的複合型態則能提供更明確的確認信號。包覆型態(Engulfing)屬於加密市場最可靠的反轉指標之一,像是「多頭包覆」和「空頭包覆」圖形能預測價格反轉。「多頭包覆」出現時,第一根為小陰線,第二根為大陽線且完全包住前一根的實體,顯示買方力壓賣方。
「烏雲蓋頂」(Dark Cloud Cover)為強烈的空方反轉訊號,表現為:一根紅K開在前一根綠K的高點,收盤跌破綠K實體中點。這種型態在加密市場格外常見,因為各種消息或技術變化都能迅速影響市場情緒。
三根K線型態為確認信號最強但較罕見。經典的「三白兵」(Three White Soldiers)多出現在下跌後,連續三根陽K,且每一根都創下更高的高點與低點,代表買方完全主導,多頭動能強勁。
空方版本「三隻烏鴉」(Three Black Crows)則是在連續下跌時出現的經典期型態,三根長陰K幾乎無影線,一次比一次收盤更低,象徵賣壓極大。這在加密幣大幅殺盤或負面新聞循環時經常看到。
技術指標:交易者的分析工具
While candlestick patterns provide insights into market sentiment, technical indicators offer quantitative analysis tools that help confirm trends, identify momentum changes, and signal potential entry and exit points. Understanding how to combine these indicators with price action analysis creates a more robust trading approach.
量化分析工具可協助確認趨勢、辨識動能變化,以及發出潛在進出場信號。了解如何將這些指標與價格行為分析結合,有助於建立更穩健的交易策略。
Moving averages represent the most fundamental technical indicators, smoothing out price fluctuations to reveal underlying trends. Use the Moving Average (MA) to reduce price changes and see the main trend direction. When a shorter-term MA, like the 50-day MA, crosses above a longer-term MA, such as the 200-day MA, it often shows a bullish crossover. In cryptocurrency markets, the 20-day and 50-day moving averages often serve as dynamic support and resistance levels.
移動平均線是最基礎的技術指標之一,可以平滑價格波動,揭示潛在趨勢。使用移動平均線(MA)能夠淡化價格的短期變化,更清楚地看見主要趨勢方向。當較短周期的MA(如50日MA)上穿較長周期的MA(如200日MA)時,通常表示為多頭交叉。在加密貨幣市場中,20日和50日移動平均線常被視為動態的支撐和壓力位。
The Relative Strength Index (RSI) helps identify overbought and oversold conditions in cryptocurrency markets. An RSI reading of above 70 usually means overbought, while a reading below 30 points to oversold conditions. However, in strongly trending cryptocurrency markets, prices can remain overbought or oversold for extended periods, making RSI divergence signals more reliable than absolute level readings.
相對強弱指數(RSI)可以協助識別加密貨幣市場的超買與超賣狀態。RSI高於70通常代表超買,而低於30則可能代表超賣。然而,在強勢趨勢的加密貨幣市場中,價格可能長時間維持在超買或超賣區,因此RSI的背離信號往往比絕對數值更加可靠。
The average directional index is used for short-term crypto strategy. It helps the investors to determine the strength of a trend. The higher the ADX is, the higher the momentum might be behind those trends. According to expert chart analysts, an ADX value above 25 indicates the strength of a trend, while a value below 20 indicates no trend. This indicator proves particularly valuable in cryptocurrency markets, where distinguishing between trending and ranging conditions can significantly impact trading success.
平均方向指標(ADX)常用於短期加密貨幣策略,幫助投資者判斷趨勢強度。ADX數值越高,趨勢動能可能越強。根據圖表專家分析,ADX超過25代表有明顯趨勢,而低於20則表示無明顯趨勢。這項指標在加密貨幣市場中特別實用,因為分辨趨勢行情與盤整行情,對交易成敗有重大影響。
Volume analysis provides crucial confirmation for price movements. Pay attention to trading volume. It shows how active people are in the market. When the volume goes up while prices rise, it means buyers are active. In the realm of crypto technical analysis, on-balance volume (OBV) stands out as a unique, valuable and one of the best crypto indicator that provides traders with insights into the underlying buying and selling pressure behind price movements. Unlike traditional volume indicators, OBV assigns more weight to volume during uptrends and less weight during downtrends, providing early warnings of potential trend changes.
成交量分析為價格變動提供關鍵確認。密切注意交易量能觀察出市場活躍程度。若交易量隨價格上漲而增加,代表買方積極參與。在加密貨幣技術分析領域,能量潮指標(OBV)是一種獨特且極具價值的指標,能揭示價格背後的買壓與賣壓。相較於傳統成交量指標,OBV會在上升趨勢時賦予更大權重,下跌時減輕權重,可提前預警潛在的趨勢變化。
The Moving Average Convergence Divergence (MACD) indicator combines trend-following and momentum characteristics. MACD consists of two lines: the MACD line (calculated by subtracting the 26-period exponential moving average from the 12-period exponential moving average) and the signal line (a 9-period exponential moving average of the MACD line). When the MACD line crosses above the signal line, it generates a bullish signal, while crosses below the signal line suggest bearish momentum.
移動平均收斂發散指標(MACD)結合了趨勢與動能特性。MACD由兩條線組成:MACD線(12期EMA減去26期EMA)以及訊號線(MACD線的9期EMA)。當MACD線上穿訊號線時,產生多頭信號;當MACD線下穿訊號線,則顯示空頭動能。
Chart Patterns and Trend Analysis
Beyond individual candlesticks and technical indicators, cryptocurrency charts often form larger patterns that can predict significant price movements. While you're not expected to know all of them, identifying chart patterns is crucial in technical analysis, helping traders anticipate potential price movements. These patterns represent the collective psychology of market participants and often repeat due to consistent human behavioral tendencies.
除了單一K線及技術指標外,加密貨幣圖表常會出現更巨大的圖形型態,這些型態能預測重大的價格波動。雖然不必全部熟記,辨識圖表型態對技術分析極為重要,幫助交易者預測潛在的價格走勢。這些型態反映了市場參與者的集體心理,因人性行為重複性而常出現。
Support and resistance levels form the foundation of technical analysis. Support represents price levels where buying pressure typically overwhelms selling pressure, causing prices to bounce higher. Resistance levels indicate where selling pressure tends to overcome buying pressure, causing prices to retreat. In cryptocurrency markets, these levels often coincide with psychological price points (like $50,000 for Bitcoin) or previous significant highs and lows.
支撐與壓力是技術分析的基礎。支撐呈現買盤通常壓過賣壓的價位,使價格反彈;壓力則是賣壓勝過買盤時,價格會受阻回落之處。在加密貨幣市場,這些位置通常與心理關卡(如比特幣的五萬美元)或過去的重要高低點重疊。
The head-and-shoulders pattern is a reversal pattern that can signal a change in trend direction. It consists of three peaks: a higher peak (head) and two lower peaks (shoulders). The pattern forms when prices reach a high (left shoulder), decline, rally to an even higher high (head), decline again, then rally to a high similar to the first shoulder (right shoulder) before declining. This pattern suggests that buying pressure is weakening and a trend reversal may be imminent.
頭肩頂型態屬於反轉型態,常預示趨勢即將轉向。其包含三個高點:一個較高的「頭」及兩個較低的「肩」。當價格形成左肩(高點)、回落、再創新高(頭)、再次回落、最後再反彈至與左肩相近的右肩後下跌,代表買方力道逐漸減弱,反轉可能隨時發生。
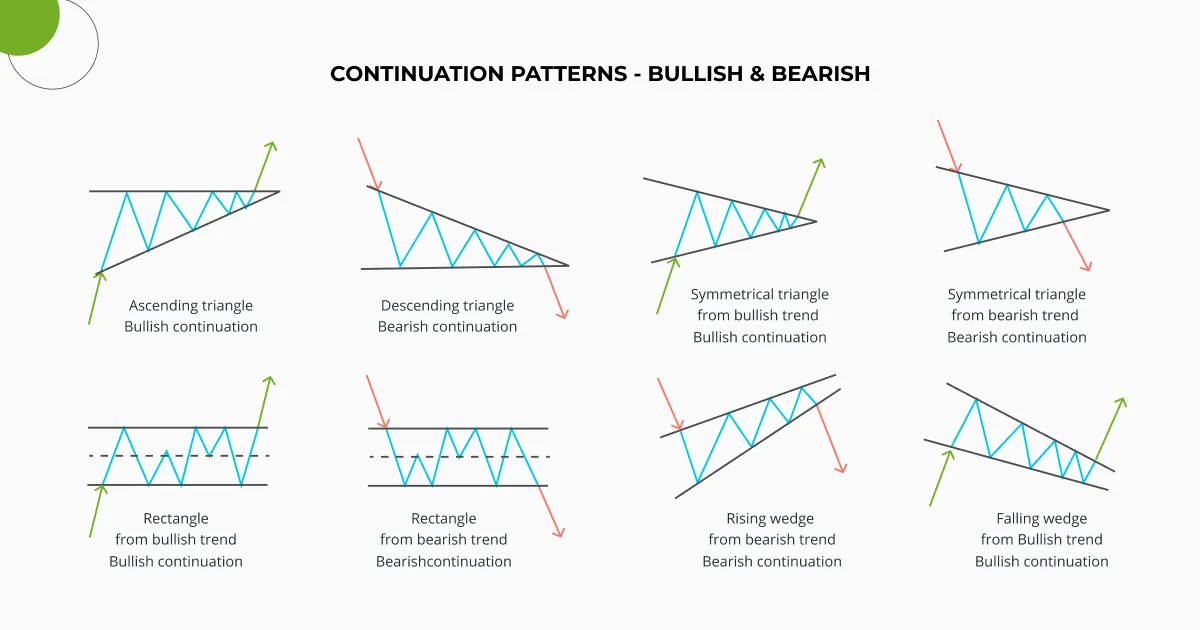
Triangle patterns frequently appear in cryptocurrency charts, representing periods of consolidation before significant price movements. Ascending triangles form when prices create higher lows while encountering resistance at a consistent level, suggesting eventual upward breakout potential. Descending triangles show lower highs meeting support at a consistent level, often indicating downward pressure. Symmetrical triangles display both converging trend lines and can break in either direction, requiring patience for confirmation.
三角型態在加密貨幣圖表中很常見,代表重大價格變動前的盤整期。上升三角形是價格持續創新低,但上方有固定壓力,暗示未來有上漲突破的潛力。下降三角形則是高點愈來愈低,底部有明確支撐,經常有往下突破的壓力。對稱三角形則上下趨勢線同時收斂,突破方向需耐心觀察確認。
Double tops and double bottoms represent some of the most reliable reversal patterns in cryptocurrency trading. A double top occurs when prices reach a high, decline, rally back to approximately the same high, then decline again. This pattern suggests that buyers cannot push prices higher despite multiple attempts, indicating potential trend reversal. Double bottoms show the opposite scenario, with prices finding support at similar levels twice, suggesting selling pressure may be exhausting.
雙頂與雙底是加密貨幣交易裡少數相當可靠的反轉型態。雙頂是價格創高後回落,再次反彈逼近高點未破,然後再下跌,暗示買方多次嘗試無力再創高,趨勢可能反轉。雙底則相反,價格兩度在相近位置獲得支撐,顯示賣壓逐漸衰竭。
Trend Lines and Channels
As the name suggests, trend lines illustrate a potential trend. Trend lines can take multiple forms and sometimes multiple trendlines are drawn on the same chart to express complex patterns. Drawing accurate trend lines requires connecting at least two significant price points, but three or more points provide stronger confirmation.
顧名思義,趨勢線用來描述可能的趨勢。趨勢線有多種畫法,有時同一圖表上會同時畫出多條,展現複雜型態。畫趨勢線時至少要連接兩個重要價位,而三個以上的點則能提供更強烈的確認。
Uptrend lines connect successive higher lows, providing dynamic support levels as prices advance. These lines help traders identify optimal buying opportunities when prices retreat to the trend line. Downtrend lines connect successive lower highs, acting as dynamic resistance levels during declining markets. These lines suggest optimal selling or shorting opportunities when prices rally to the trend line.
上升趨勢線連結連續的高低點,每次回調碰到趨勢線即形成動態支撐,有助於交易者判斷低接時機。下降趨勢線則連結持續降低的高點,於跌勢中形成動態壓力,適合尋找短線放空或逢高出場的機會。
Channel analysis extends trend line concepts by drawing parallel lines above and below the main trend line. In uptrending channels, the lower line connects higher lows while the upper line connects higher highs, creating a channel within which prices typically oscillate. Traders can buy near the lower channel line and sell near the upper channel line, maximizing profits within the trending environment.
通道分析則是在主要趨勢線上下各畫一條平行線。上升通道下緣連結較高的低點,上緣連結新高,形成價格在其中震盪的通道。交易者可考慮在下緣進場、上緣獲利出場,善用趨勢區間內的波動來獲利。
Fibonacci Analysis in Cryptocurrency Markets
Learning about advanced patterns like the Fibonacci retracements and extensions can help you find possible support and resistance levels using the golden ratio. Fibonacci analysis applies mathematical ratios derived from the Fibonacci sequence to identify potential price levels where reversals or continuations might occur.
學習高階型態,如斐波那契回撤與延伸,可以運用黃金比例尋找潛在支撐與壓力位置。斐波那契分析是將斐波那契數列的數學比例套用在圖表,藉此預測可能反轉或持續的價格區間。
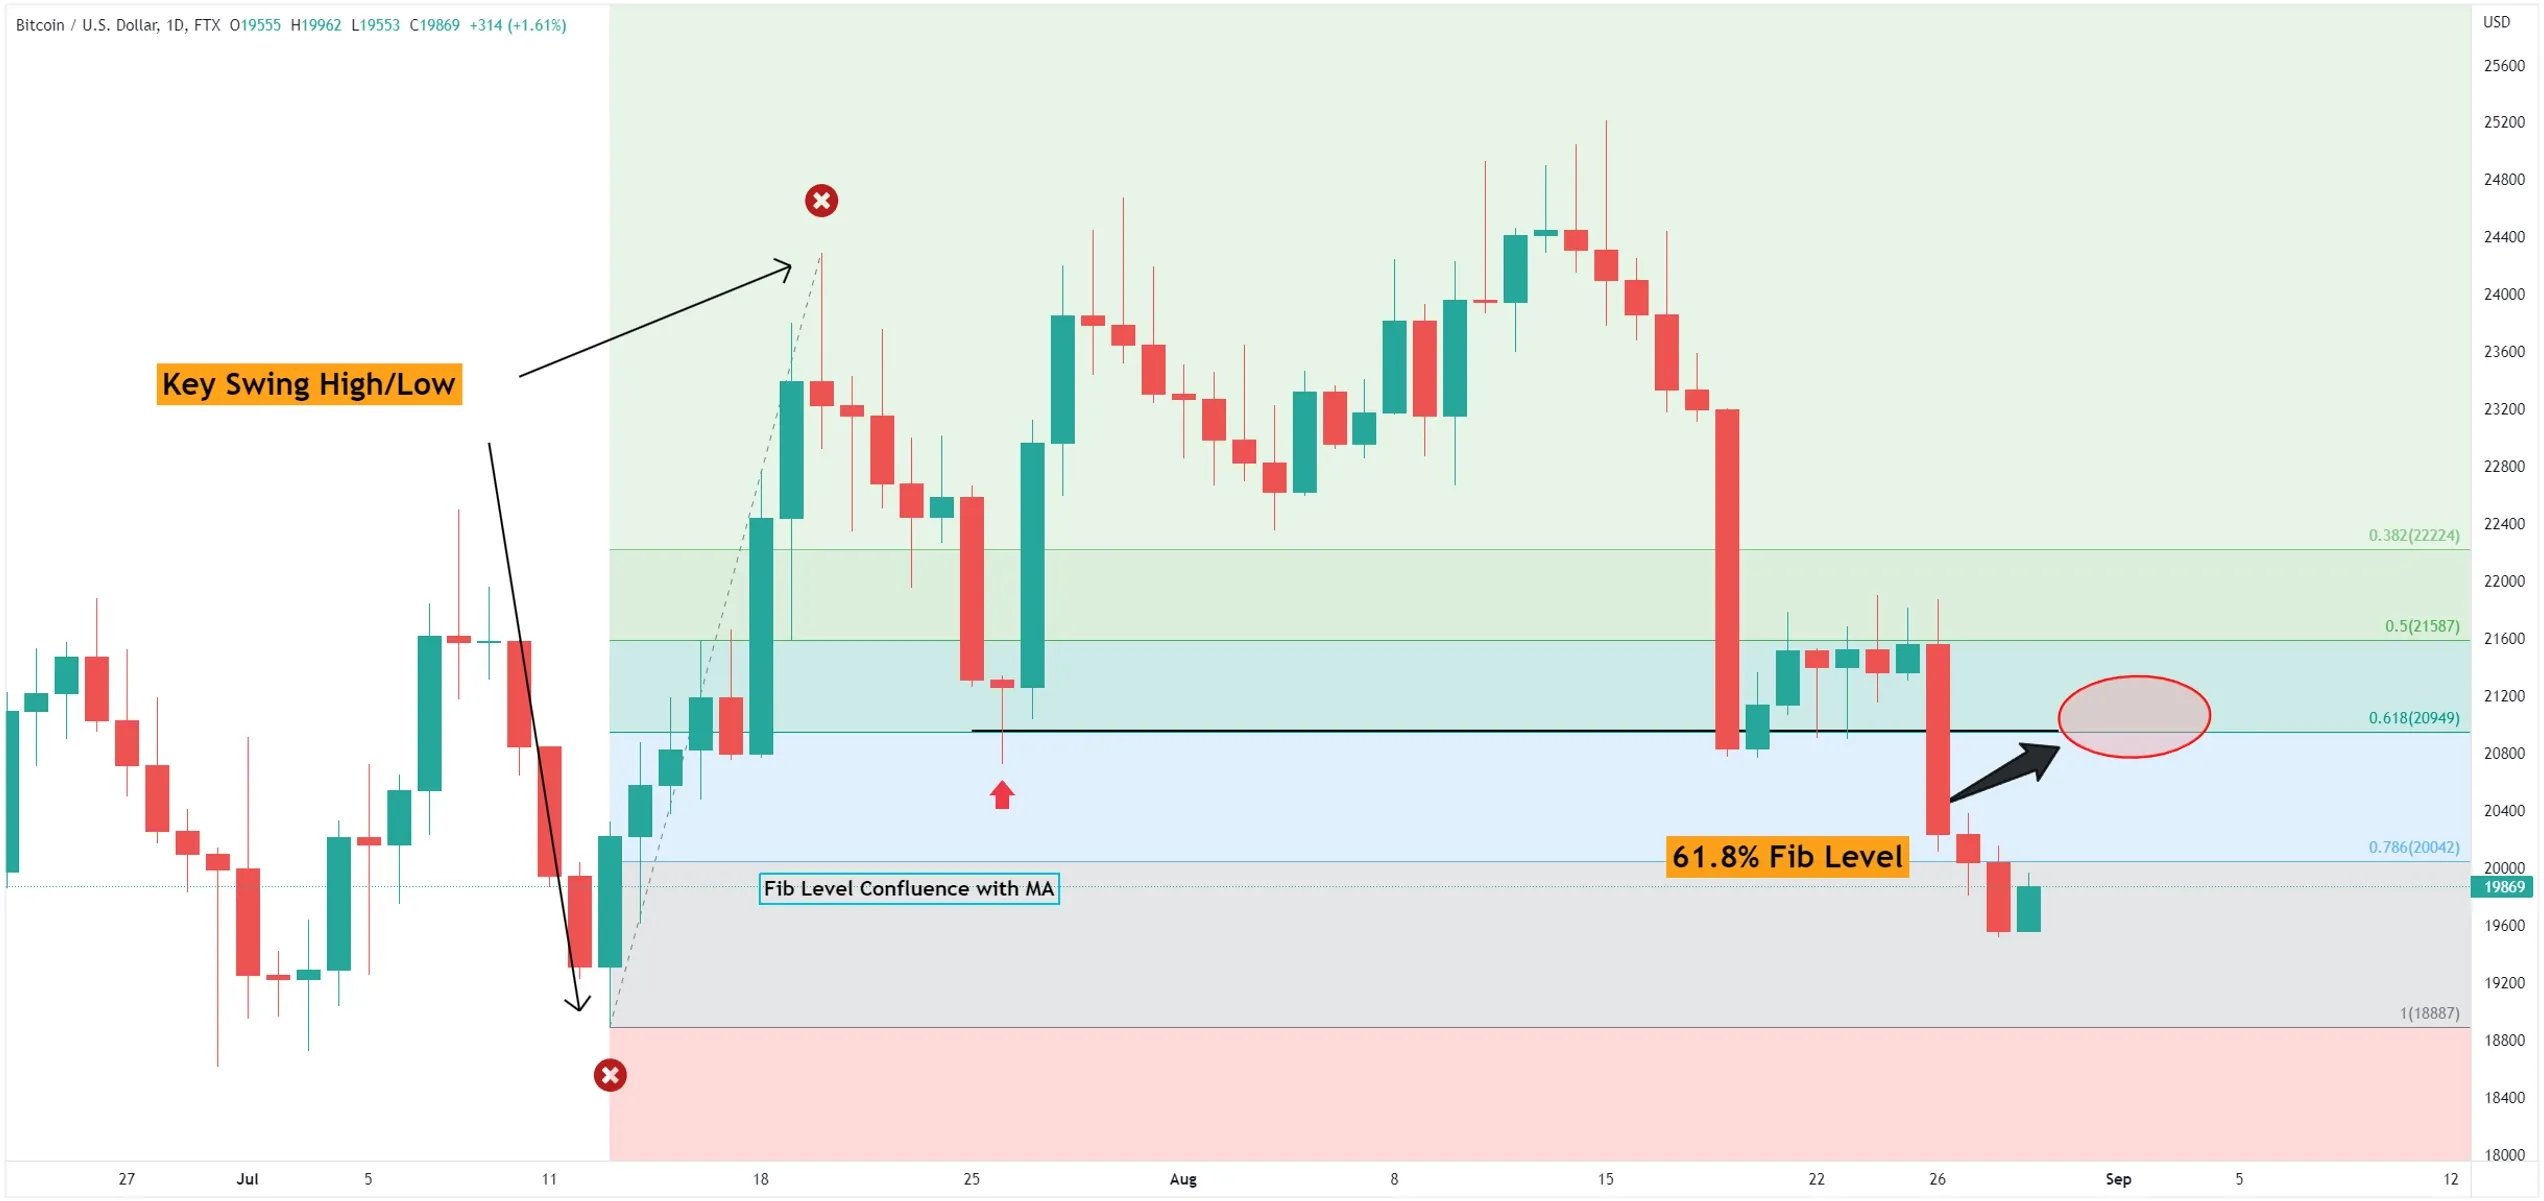
To use Fibonacci retracement, traders look for a big price swing, either from high to low or low to high. They then find the distance and break it down using key Fibonacci ratios: 23.6%, 38.2%, 50%, 61.8%, and 100%. These levels often act as support during uptrends or resistance during downtrends, providing traders with specific price targets for entries, exits, or stop-loss placement.
使用斐波那契回撤時,交易者需針對一段明顯的價格波動(高至低或低至高)繪製後,運用關鍵比例23.6%、38.2%、50%、61.8%、100%分割該區間。這些價格區通常在漲勢中成為支撐,在跌勢中成為壓力,提供交易者明確的進場、出場或停損參考。
Fibonacci extensions project potential price targets beyond the current trend. After identifying a significant price swing and retracement, traders use extension levels (typically 127.2%, 161.8%, and 261.8%) to estimate where prices might reach if the trend resumes. These extensions prove particularly valuable in cryptocurrency markets, where parabolic moves can carry prices far beyond traditional technical analysis expectations.
斐波那契延伸則用來預測趨勢突破後的目標價。當價格完成一段明顯的波動與回調後,交易者可以運用127.2%、161.8%、261.8%等延伸比例推算下個目標價位。這項技巧在加密貨幣市場特別有價值,因為瘋狂牛市時,價格常跳脫傳統技術分析預期。
Time Frame Analysis and Multiple Chart Perspective
Successful cryptocurrency trading requires analyzing multiple time frames to understand both short-term opportunities and long-term trends. The general rule suggests using a higher time frame to identify the overall trend direction, an intermediate time frame for timing entries and exits, and a lower time frame for precise execution.
成功的加密貨幣交易需要分析多重時間週期,才能同時把握短線機會與長線趨勢。一般做法是先在較大週期判斷總體趨勢,再以中等週期決定進出場時機,最後以短期週期精確執行交易。
For example, swing traders might analyze weekly charts to identify major trend direction, daily charts to pinpoint entry opportunities, and hourly charts to execute trades with optimal timing. This approach helps avoid the common mistake of fighting the major trend while scalping in the opposite direction of longer-term momentum.
舉例來說,波段交易者會先看週線方向,再用日線尋找進場區,最後以小時線抓實際下單的最佳時機。這種方式有助於避免常見的錯誤──在主趨勢相反時進行短線操作而導致虧損。
The concept of time frame confluence occurs when signals align across multiple time frames, providing higher probability trading opportunities. When daily, weekly, and monthly charts all suggest bullish momentum, any pullback to support levels represents a higher probability buying opportunity than signals appearing on only one time frame.
所謂多週期共振,意指不同時間週期上的技術訊號同時指向相同方向,從而大幅提高交易勝算。比如日線、週線和月線同步偏多時,回檔到支撐位進場,勝率通常明顯高於只靠單一路徑訊號。
Volume Analysis and Market Sentiment
Trading volume provides crucial insights into the conviction behind price movements. High volume during price advances suggests strong buying interest and increases the likelihood of continued upward movement. Low volume during rallies might indicate weak buying interest and higher probability of reversal.
交易量變化可清楚反映價格變動背後的信心。若價格上漲時伴隨高成交量,說明買方企圖明確,後市續漲機會較高。反之,反彈時量能萎縮,則可能只是虛弱的回升,容易出現反轉。
Volume spikes often precede significant price movements in cryptocurrency markets. When Bitcoin or other major cryptocurrencies experience unusual volume increases, it typically signals that important news or technical developments are driving increased trader interest. These volume spikes can provide early warnings of impending price volatility.
在加密貨幣市場,成交量突然暴增往往預告價格將劇烈波動。當比特幣或其他主流幣成交驟增時,代表背後可能有重大消息或技術突破,脈動的成交量就是新一輪波動來臨的早鳥信號。
Volume divergence occurs when price and volume move in opposite directions, often signaling potential trend changes. If cryptocurrency prices reach new highs while volume decreases, it suggests weakening buying interest despite higher prices. Conversely, if prices make new lows while volume decreases, it might indicate that selling pressure is diminishing.
成交量背離是指價格與成交量走勢不同步,這常預告趨勢即將變化。當價格創新高但成交量反而下降,代表買方意願正在減弱。相反地,價格創新低但成交量反而配合縮減,則可能是賣壓耗竭的徵兆。
Risk Management and Position Sizing
Risk management: Always implement risk management strategies, such as setting
風險管理:務必落實風險控管,例如設置stop-loss orders, when trading based on chart patterns to protect against false signals. Technical analysis provides tools for identifying trading opportunities, but proper risk management determines long-term trading success.
停損單是在依據圖表形態交易時,防止誤信號而設置的基本風險控管工具。技術分析能協助識別交易機會,但正確的風險管理才是長期交易成功的關鍵。
Stop-loss orders represent the most fundamental risk management tool, automatically closing positions when prices move against your analysis. In cryptocurrency markets, stop-losses should account for typical volatility levels to avoid premature execution during normal price fluctuations. Many successful traders place stop-losses just beyond significant support or resistance levels, giving their positions room to breathe while limiting potential losses.
停損單是最基本的風險控管工具,能在價格朝著你分析相反方向波動時,自動平倉。在加密貨幣市場中,設置停損時應考慮市場的典型波動,以免正常價格波動時過早被觸發。許多成功的交易者會將停損點設在重要支撐或壓力位外側,讓部位有適當空間,同時限制潛在損失。
Position sizing determines how much capital to risk on each trade based on your analysis confidence and overall portfolio management strategy. A common approach involves risking no more than 1-2% of total trading capital on any single trade, regardless of confidence level. This approach ensures that even a series of losing trades won't significantly damage your overall trading account.
資金控管決定每一筆交易願意承擔多少資本風險,依據你的分析信心以及整體投資組合策略調整。常見做法是每一單只承擔總交易資金的1-2%風險,無論信心水平如何。這樣,即使連續虧損,也不會對整體交易帳戶造成重大損失。
Take-profit levels help lock in gains when prices reach your analysis targets. Many traders use a risk-reward ratio approach, seeking profits that are at least twice as large as their potential losses. This approach means that even with a 50% win rate, traders can remain profitable over time.
停利點有助於在價格達到分析目標時獲利了結。許多交易者採用風險報酬比策略,尋求至少是潛在損失兩倍的獲利。這種方法即使勝率只有50%,長期下來也有機會保持獲利。
Advanced Concepts and Market Psychology
進階概念與市場心理
Understanding market psychology helps interpret technical analysis signals within broader context. Fear and greed drive most market movements, creating recurring patterns that technical analysis helps identify. During bull markets, traders become increasingly optimistic, often ignoring negative signals and focusing only on bullish patterns. Conversely, bear markets create pessimism that can cause traders to ignore legitimate bullish signals.
理解市場心理,有助於在更廣泛脈絡下解讀技術分析信號。恐懼與貪婪驅動大部分市場波動,形塑出技術分析能辨認的周期性模式。在牛市中,交易者越來越樂觀,常忽視利空信號,僅關注多頭型態;反之,熊市則產生悲觀情緒,可能導致投資人忽略真正的多頭訊號。
Market cycles in cryptocurrency follow predictable psychological patterns. Accumulation phases occur when informed traders quietly build positions while general market sentiment remains negative. Public participation phases see increasing mainstream interest and media coverage. Distribution phases happen when experienced traders begin selling to enthusiastic newcomers. Decline phases feature widespread pessimism and capitulation selling.
加密貨幣市場週期遵循可預測的心理模式。累積階段發生於消息靈通者在市場氣氛低迷時悄悄布局;公眾參與階段則有主流關注與媒體報導增加;分散階段是經驗豐富的交易者將持有部位賣給熱情新手;下跌階段則充斥大量悲觀與投降性拋售。
Sentiment analysis complements technical analysis by providing insights into overall market mood. Market sentiment: Look at social media or news to gauge how the community feels about the crypto. Social media sentiment, news coverage tone, and options market data provide additional context for interpreting technical analysis signals.
市場情緒分析輔助技術分析,能提供整體市場氛圍的見解。市場情緒:透過觀察社群媒體與新聞報導,判斷社群對特定幣種的態度。社群討論聲量、媒體報導氛圍與選擇權市場數據,都是解讀技術信號的重要參考。
Practical Application and Trading Strategies
實務應用與交易策略
You'll need a mix of all of the methods in this article to analyze crypto markets and trading. An example workflow for crypto trading analysis might include: Research: Conduct fundamental analysis by studying the project, its news, and developments. Market sentiment: Look at social media or news to gauge how the community feels about the crypto. Technical analysis: Open a chart and analyze the price using indicators like RSI, MACD, and trend lines. On-chain data: Check on-chain metrics for potential market moves.
要分析加密貨幣市場並進行交易,需要將本文提及的各方法靈活結合。舉例來說,分析加密貨幣可依下列流程進行:研究:從專案、消息與進展做基本面分析。市場情緒:觀察社群媒體與新聞,瞭解市場氛圍。技術分析:開啟圖表,利用RSI、MACD、趨勢線等指標分析價格。鏈上數據:檢視鏈上指標預判市場可能變動。
Developing a systematic approach to chart analysis helps maintain consistency and objectivity in trading decisions. Begin each analysis session by identifying the major trend direction on higher time frames. Next, look for significant support and resistance levels that might impact price movement. Then examine candlestick patterns and technical indicators for entry and exit timing.
建立系統化的圖表分析流程,有助於交易決策保持一致性與客觀性。每次分析時,先判斷高週期主趨勢,再找出關鍵支撐與壓力區,接著觀察K線型態與技術指標,篩選進出場時機。
Technical Indicators: Use a combination of indicators for more accurate predictions. Chart Patterns: Identify key patterns that signal trend reversals. Risk Management: Always use stop-loss orders to limit potential losses. Combining multiple analytical approaches increases signal reliability while reducing false signal frequency.
技術指標:結合多種指標提升預測準確性。圖表型態:辨識關鍵反轉型態。風險管理:務必設置停損單限制損失。結合多元分析方式,能提升信號可靠度、降低誤信號頻率。
Backtesting your analytical approach provides valuable insights into strategy effectiveness. Review historical charts to identify how your chosen patterns and indicators would have performed in various market conditions. This process helps refine your analytical skills and builds confidence in your trading approach.
回測你的分析方法,能檢視策略效果。檢查過去圖表,看看你選擇的型態與指標在各種市況下的表現。這個過程有助於強化分析技能並建立交易信心。
Common Mistakes and How to Avoid Them
常見錯誤與避免方法
New cryptocurrency traders often make predictable mistakes that proper education can help avoid. Over-reliance on single indicators represents one of the most common errors. No single technical indicator provides consistently accurate signals in all market conditions. Successful traders combine multiple indicators and analytical approaches for signal confirmation.
新手常犯的錯誤,其實可以透過正確學習預防。過度依賴單一指標是最常見的錯誤之一。沒有任何一種技術指標能在所有市場狀況下持續保持高準度。成功交易者會結合多種指標和分析方式,互相驗證信號。
Analysis paralysis occurs when traders attempt to use too many indicators simultaneously, creating conflicting signals and decision-making difficulties. Focus on mastering a few indicators rather than trying to use every available tool. Start with basic trend identification, support and resistance levels, and one or two momentum indicators.
指標癱瘓,是因同時用太多指標而產生矛盾信號、加大決策難度。應專注熟練幾種指標,而非貪多。可先從趨勢判斷、支撐壓力區,再加上一兩個動能指標著手。
Ignoring market context leads to poor trading decisions even when technical analysis appears clear. A perfect bullish setup on a lower time frame means little if major cryptocurrency news or broader market conditions suggest bearish pressure. Always consider fundamental factors and market sentiment alongside technical analysis.
忽略市場總體脈絡,即使技術分析信號明確,也容易做出錯誤決策。即便低週期出現完美多頭訊號,若有重大幣圈消息或大環境偏空,這類信號的參考價值也會大打折扣。務必將基本面與市場情緒納入決策考量。
Emotional trading undermines even the best technical analysis. Fear causes traders to exit profitable positions too early, while greed leads to holding losing positions too long. Develop and follow a systematic trading plan that includes predetermined entry, exit, and risk management rules.
情緒性交易會破壞再好的分析。恐懼讓人提早賣出獲利部位,貪婪則令投資人死抱虧損部位不放。務必制定並嚴格執行交易計畫,提前規劃進場、出場及風控原則。
The Evolution of Crypto Technical Analysis
加密貨幣技術分析的演進
Technical analysis continues evolving as cryptocurrency markets mature and new analytical tools emerge. A relatively new but intriguing formation, the Three Blind Mice pattern captured the attention of traders in 2024 when it emerged on Bitcoin's chart. As markets develop, new patterns and analytical approaches emerge to help traders adapt to changing conditions.
隨著加密貨幣市場成熟並出現更多分析工具,技術分析也持續演化。2024年,比特幣圖表中出現了新穎的「三隻盲鼠」型態,引起交易者關注。隨著市場變化,會不斷有新型態與分析方法問世,幫助投資人適應動態環境。
Algorithmic trading and artificial intelligence increasingly influence cryptocurrency markets, potentially affecting traditional technical analysis effectiveness. However, human psychology remains a constant factor in market behavior, ensuring that classical technical analysis principles retain relevance even as markets evolve.
演算法交易與人工智慧對加密貨幣市場的影響日益加深,這或許會影響傳統技術分析的有效性。不過,人類心理始終是市場行為的核心,因此傳統技術分析原理在市場演變過程中仍具參考價值。
Building Your Technical Analysis Expertise
培養你的技術分析專業
It is best to try your chart reading skills on a demo account before you start real trading so you can hone your skills without losing money. Practice with paper trading or demo accounts allows you to test your analytical skills without financial risk while building confidence in your approach.
在開始實盤交易前,建議先用模擬帳戶練習圖表判讀技巧。紙上交易或模擬帳戶能讓你無風險磨練技巧,建立自信。
Remember, the more you learn about technical analysis and chart reading, the better your chances of success in the crypto market. Continuous education through books, courses, and market observation helps refine your analytical skills over time. Markets constantly evolve, requiring ongoing learning and adaptation.
記得,技術分析和圖表判讀越熟練,你在加密市場就越有勝算。閱讀書籍、上課進修和實際觀察市場,都能持續提升分析能力。市場不斷變化,必須不斷學習與適應。
Consider keeping a trading journal to document your analytical decisions and their outcomes. Recording your reasoning for each trade, including chart screenshots and analysis notes, provides valuable data for improving your approach over time. Review both successful and unsuccessful trades to identify patterns in your decision-making process.
建議你保持交易日誌,記錄自己的分析決策與結果。每筆交易都留下背後推理、圖表截圖和分析備註,能為長期流程優化提供寶貴數據。經常回顧成功和失敗案例,找出自己決策中的規律。
Conclusion: Mastering the Art and Science of Chart Reading
結論:精通圖表判讀的藝術與科學
Learning to read cryptocurrency charts effectively combines analytical skill with psychological discipline. By applying the principles of technical analysis, you can gain a better understanding of market trends, make informed decisions, and potentially maximize profits. Success requires patience, practice, and continuous learning as markets evolve and new analytical techniques emerge.
有效地判讀加密貨幣圖表,需要分析技巧與心理紀律並重。運用技術分析原理,有助深入理解市場趨勢、做出明智決策並最大化潛在利潤。成功交易需要耐心、實踐與隨市場演化持續學習。
Technical analysis provides a structured approach to understanding market behavior, but it's not infallible. Research into the reliability of candlestick patterns suggests that they do have some predictive value, but as with all trading strategies, their efficacy is likely dependent on various factors. Combine technical analysis with proper risk management, fundamental understanding, and realistic expectations for the best long-term results.
技術分析提供了理解市場行為的結構化方法,但它並非萬無一失。相關研究發現,K線型態確實具有部分預測性;不過其效果與所有交易策略一樣,會受到多種因素影響。必須將技術分析、妥善風險管理、基本面認識與合理預期綜合運用,才能在長期取得最佳成效。
The cryptocurrency market offers unique opportunities for those willing to develop proper analytical skills. Unlike traditional markets with limited trading hours, crypto markets operate continuously, providing constant opportunities to practice and refine your chart reading abilities. Start with basic concepts, master fundamental patterns and indicators, then gradually incorporate more advanced techniques as your experience grows.
加密貨幣市場為願意培養分析能力的人提供了獨特機會。相比於交易時間有限的傳統市場,加密市場全年無休,讓你有更多時間練習與精進圖表判讀。從基礎觀念與基本型態、指標著手,隨經驗累積逐步進階到更深層技巧。
Remember that successful trading involves much more than pattern recognition. It requires disciplined execution, proper risk management, emotional control, and continuous adaptation to changing market conditions. Use technical analysis as one component of a comprehensive trading approach that includes fundamental analysis, risk management, and psychological discipline.
別忘了,成功交易遠不只是圖表辨識。還需紀律執行、完善風控、情緒管理與持續適應市場變化。技術分析只是整體交易架構的一環,須結合基本面分析、風險管理與心理素質共同發揮。
The journey to mastering cryptocurrency chart analysis takes time and dedication, but the skills you develop will serve you throughout your trading career. Begin with paper trading to practice your skills risk-free, gradually transition to small position sizes as confidence builds, and always maintain focus on long-term skill development rather than short-term profits. With patience and persistence, technical analysis can become a valuable tool in your cryptocurrency trading toolkit.
精通加密貨幣圖表分析需要時間與投入,但所養成的技能將終身受用。從模擬交易開始練習,待技巧與信心逐漸提升後,再逐步增加實盤操作部位。務必以長遠技能培養為核心,而非追逐短期利潤。只要有耐心並持續努力,技術分析將成為你加密貨幣交易的重要利器。