


The cryptocurrency market never sleeps, with billions of dollars flowing through digital exchanges every single day. Whether you're just getting started or looking to enhance your trading skills, this beginner's guide will walk you through the basics of reading crypto charts and utilizing TA to make informed decisions. Understanding how to read cryptocurrency charts represents one of the most fundamental skills any trader or investor can develop in this space.
Think of cryptocurrency charts like weather maps for financial storms and sunshine. Just as meteorologists use atmospheric data to predict weather patterns, crypto traders use price charts to forecast potential market movements. The difference lies in the stakes – instead of deciding whether to carry an umbrella, you're making decisions that could significantly impact your financial future.
The Foundation of Technical Analysis
Technical analysis (TA) is a method of analyzing price data of cryptocurrencies to identify patterns and trends. Unlike fundamental analysis, which examines external factors such as news, regulatory developments, and project fundamentals, technical analysis focuses entirely on price history and trading volume data. This approach operates on three core principles that have guided traders for over a century.
The first principle suggests that market prices reflect all available information. When Bitcoin's price moves from $60,000 to $65,000, that movement theoretically incorporates every piece of relevant news, every trader's sentiment, and every fundamental factor affecting the asset. The second principle states that prices move in trends, not randomly. These trends can persist for days, weeks, or even months, providing opportunities for traders who can identify them early. The third principle holds that history tends to repeat itself, particularly in terms of human psychology and market behavior patterns.
This approach is crucial for cryptocurrency trading, as it helps investors identify trends, patterns, and potential buy or sell signals. The cryptocurrency market's 24/7 nature makes technical analysis particularly valuable, as traditional market hours and fundamental news cycles don't apply in the same way they do to stock markets.
Understanding Chart Types and Time Frames
Before diving into complex patterns and indicators, you need to understand the basic building blocks of chart analysis. Cryptocurrency exchanges typically offer several chart types, each presenting price information differently and serving specific analytical purposes.
Line charts represent the simplest form of price visualization, connecting closing prices over time with a single continuous line. While line charts provide a clean overview of general price direction, they omit crucial details like opening prices, daily highs and lows, and intraday volatility. These charts work well for identifying long-term trends but lack the granular information needed for precise entry and exit timing.
Bar charts offer more comprehensive information, displaying opening, closing, high, and low prices for each time period. Each bar consists of a vertical line showing the price range, with small horizontal lines extending left and right to indicate opening and closing prices respectively. While bar charts provide complete price information, many traders find them visually cluttered and difficult to interpret quickly during volatile market conditions.
Candlestick charts have emerged as the preferred visualization method for most cryptocurrency traders. Each "candle" on a trader's chart provides key details about the opening, closing, high, and low prices within a chosen time frame, such as minutes, hours, days, or weeks. The visual appeal of candlestick charts lies in their intuitive color coding and distinctive shapes, which immediately convey market sentiment and momentum information.
Time frame selection significantly impacts your analysis and trading approach. Scalpers might focus on one-minute or five-minute charts to capture quick price movements, while long-term investors typically examine daily, weekly, or monthly charts to identify major trends. The key principle to remember is that higher time frames provide more reliable signals but fewer trading opportunities, while lower time frames offer more signals but with higher noise and false signals.
Mastering Candlestick Fundamentals
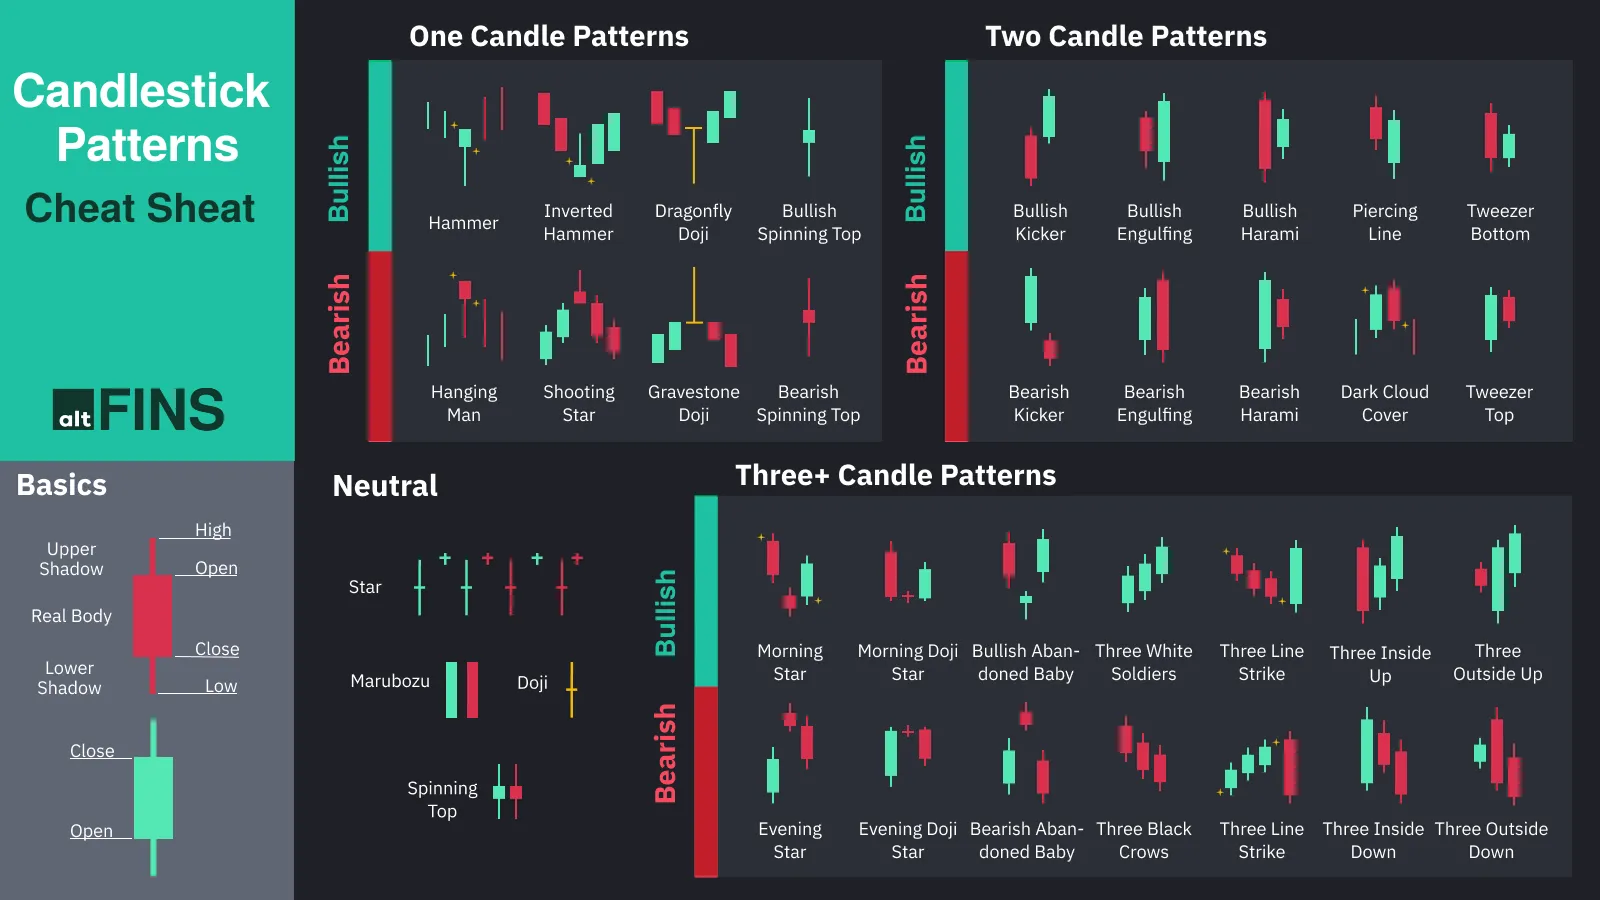
Candlesticks consist of the open, high, low and close prices for a specific period. The thick rectangular 'body' represents the range between the open and close. The thin 'wicks' or 'shadows' represent the highs and lows. Understanding these components forms the foundation for reading market sentiment and predicting potential price movements.
The candlestick body reveals the relationship between opening and closing prices. When the closing price exceeds the opening price, the candle typically appears green or white, indicating bullish sentiment during that time period. Conversely, when the closing price falls below the opening price, the candle appears red or black, suggesting bearish pressure dominated that session.
The shadows or wicks extending from the candlestick body tell a story about the session's price action. Long upper shadows indicate that buyers pushed prices higher during the session, but sellers eventually drove prices back down toward the opening level. Long lower shadows suggest that sellers initially controlled the session, pushing prices down, but buyers stepped in to drive prices back up by the close.
The relationship between the body and shadows provides insights into market conviction. A large body with small shadows indicates strong directional movement and conviction from either buyers or sellers. Small bodies with long shadows suggest indecision and potentially impending trend changes. Equal-length shadows extending from both ends of a small body create what traders call a "spinning top," indicating maximum indecision in the market.
Essential Candlestick Patterns for Crypto Trading
Candlestick patterns are essential tools for traders in the cryptocurrency market. They help visualize market sentiment by illustrating price movements over specific time periods. Learning to recognize these patterns can provide significant advantages in timing market entries and exits.
Single candlestick patterns often provide the clearest and most immediate signals. The Doji stands out as perhaps the most important single-candle pattern, characterized by opening and closing prices that are virtually identical. The Doji is a candlestick pattern that reflects indecision in the market. When a Doji appears after a strong trend, it often signals potential trend exhaustion and possible reversal.
The Hammer, a single-candlestick pattern commonly observed in crypto candlestick charts, serves as a potent signal for a potential bullish reversal in market trends. This pattern is characterized by the presence of a long lower shadow, coupled with a closing price that surpasses the opening price. The hammer's psychological interpretation suggests that sellers drove prices significantly lower during the session, but buyers regained control and pushed prices back up, creating a foundation for potential upward movement.
The shooting star presents the bearish counterpart to the hammer. The shooting star is the same shape as the inverted hammer, but is formed in an uptrend: it has a small lower body, and a long upper shadow which must be at least twice the length of the body. This pattern indicates that buyers initially pushed prices higher, but sellers overwhelmed them, driving prices back down near the opening level.
Two-candlestick patterns provide stronger confirmation signals by showing how market sentiment evolves over multiple sessions. Engulfing patterns rank among the most reliable reversal indicators in cryptocurrency markets. Key patterns, such as the Bullish Engulfing Pattern and Bearish Engulfing Pattern, help traders predict potential price reversals. A bullish engulfing pattern occurs when a small bearish candle is followed by a larger bullish candle that completely encompasses the previous candle's body, suggesting that buyers have overwhelmed sellers.
The dark cloud cover candlestick pattern indicates a bearish reversal – a black cloud over the previous day's optimism. It comprises two candlesticks: a red candlestick which opens above the previous green body, and closes below its midpoint. This pattern particularly resonates in cryptocurrency markets, where sentiment can shift rapidly based on news or technical developments.
Three-candlestick patterns provide the strongest confirmation signals but occur less frequently. The Three White Soldiers pattern emerges as a bullish signal in the realm of crypto candlestick chart analysis. Typically observed following a downtrend, this pattern unfolds across three consecutive candles, each boasting higher highs and higher lows. This pattern suggests that buyers have gained firm control and are systematically driving prices higher.
The bearish equivalent, Three Black Crows, indicates strong selling pressure. The three black crows candlestick pattern comprises of three consecutive long red candles with short or non-existent shadows. Each session opens at a similar price to the previous day, but selling pressures push the price lower and lower with each close. In cryptocurrency markets, this pattern often appears during major sell-offs or negative news cycles.
Technical Indicators: The Trader's Toolkit
While candlestick patterns provide insights into market sentiment, technical indicators offer quantitative analysis tools that help confirm trends, identify momentum changes, and signal potential entry and exit points. Understanding how to combine these indicators with price action analysis creates a more robust trading approach.
Moving averages represent the most fundamental technical indicators, smoothing out price fluctuations to reveal underlying trends. Use the Moving Average (MA) to reduce price changes and see the main trend direction. When a shorter-term MA, like the 50-day MA, crosses above a longer-term MA, such as the 200-day MA, it often shows a bullish crossover. In cryptocurrency markets, the 20-day and 50-day moving averages often serve as dynamic support and resistance levels.
The Relative Strength Index (RSI) helps identify overbought and oversold conditions in cryptocurrency markets. An RSI reading of above 70 usually means overbought, while a reading below 30 points to oversold conditions. However, in strongly trending cryptocurrency markets, prices can remain overbought or oversold for extended periods, making RSI divergence signals more reliable than absolute level readings.
The average directional index is used for short-term crypto strategy. It helps the investors to determine the strength of a trend. The higher the ADX is, the higher the momentum might be behind those trends. According to expert chart analysts, an ADX value above 25 indicates the strength of a trend, while a value below 20 indicates no trend. This indicator proves particularly valuable in cryptocurrency markets, where distinguishing between trending and ranging conditions can significantly impact trading success.
Volume analysis provides crucial confirmation for price movements. Pay attention to trading volume. It shows how active people are in the market. When the volume goes up while prices rise, it means buyers are active. In the realm of crypto technical analysis, on-balance volume (OBV) stands out as a unique, valuable and one of the best crypto indicator that provides traders with insights into the underlying buying and selling pressure behind price movements. Unlike traditional volume indicators, OBV assigns more weight to volume during uptrends and less weight during downtrends, providing early warnings of potential trend changes.
The Moving Average Convergence Divergence (MACD) indicator combines trend-following and momentum characteristics. MACD consists of two lines: the MACD line (calculated by subtracting the 26-period exponential moving average from the 12-period exponential moving average) and the signal line (a 9-period exponential moving average of the MACD line). When the MACD line crosses above the signal line, it generates a bullish signal, while crosses below the signal line suggest bearish momentum.
Chart Patterns and Trend Analysis
Beyond individual candlesticks and technical indicators, cryptocurrency charts often form larger patterns that can predict significant price movements. While you're not expected to know all of them, identifying chart patterns is crucial in technical analysis, helping traders anticipate potential price movements. These patterns represent the collective psychology of market participants and often repeat due to consistent human behavioral tendencies.
Support and resistance levels form the foundation of technical analysis. Support represents price levels where buying pressure typically overwhelms selling pressure, causing prices to bounce higher. Resistance levels indicate where selling pressure tends to overcome buying pressure, causing prices to retreat. In cryptocurrency markets, these levels often coincide with psychological price points (like $50,000 for Bitcoin) or previous significant highs and lows.
The head-and-shoulders pattern is a reversal pattern that can signal a change in trend direction. It consists of three peaks: a higher peak (head) and two lower peaks (shoulders). The pattern forms when prices reach a high (left shoulder), decline, rally to an even higher high (head), decline again, then rally to a high similar to the first shoulder (right shoulder) before declining. This pattern suggests that buying pressure is weakening and a trend reversal may be imminent.
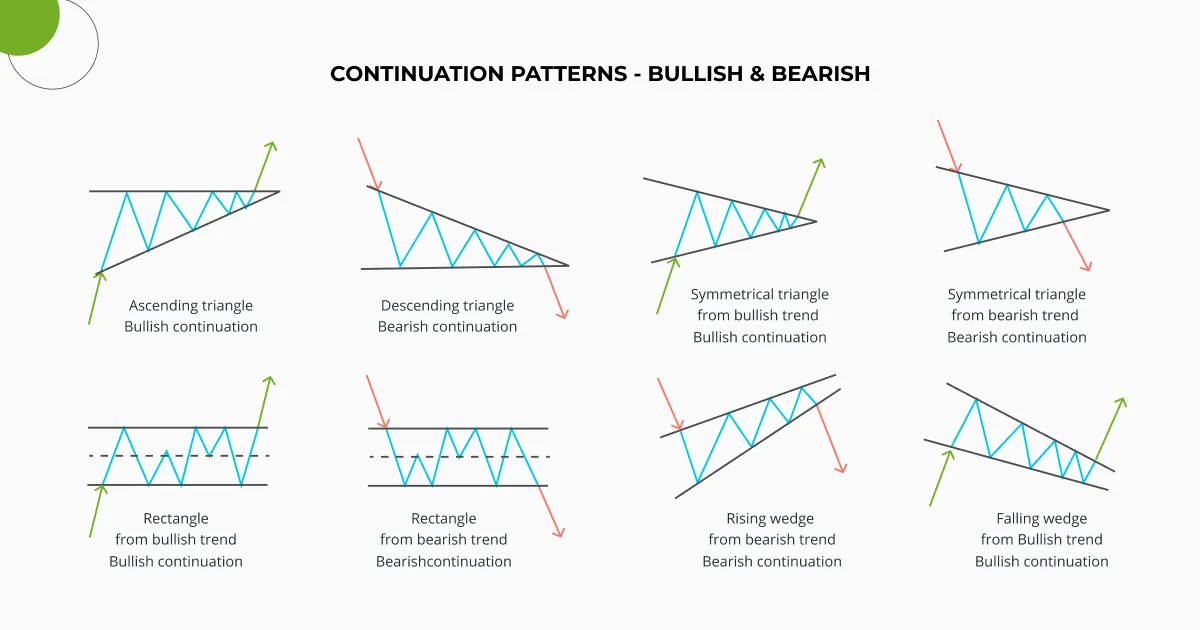
Triangle patterns frequently appear in cryptocurrency charts, representing periods of consolidation before significant price movements. Ascending triangles form when prices create higher lows while encountering resistance at a consistent level, suggesting eventual upward breakout potential. Descending triangles show lower highs meeting support at a consistent level, often indicating downward pressure. Symmetrical triangles display both converging trend lines and can break in either direction, requiring patience for confirmation.
Double tops and double bottoms represent some of the most reliable reversal patterns in cryptocurrency trading. A double top occurs when prices reach a high, decline, rally back to approximately the same high, then decline again. This pattern suggests that buyers cannot push prices higher despite multiple attempts, indicating potential trend reversal. Double bottoms show the opposite scenario, with prices finding support at similar levels twice, suggesting selling pressure may be exhausting.
Trend Lines and Channels
As the name suggests, trend lines illustrate a potential trend. Trend lines can take multiple forms and sometimes multiple trendlines are drawn on the same chart to express complex patterns. Drawing accurate trend lines requires connecting at least two significant price points, but three or more points provide stronger confirmation.
Uptrend lines connect successive higher lows, providing dynamic support levels as prices advance. These lines help traders identify optimal buying opportunities when prices retreat to the trend line. Downtrend lines connect successive lower highs, acting as dynamic resistance levels during declining markets. These lines suggest optimal selling or shorting opportunities when prices rally to the trend line.
Channel analysis extends trend line concepts by drawing parallel lines above and below the main trend line. In uptrending channels, the lower line connects higher lows while the upper line connects higher highs, creating a channel within which prices typically oscillate. Traders can buy near the lower channel line and sell near the upper channel line, maximizing profits within the trending environment.
Fibonacci Analysis in Cryptocurrency Markets
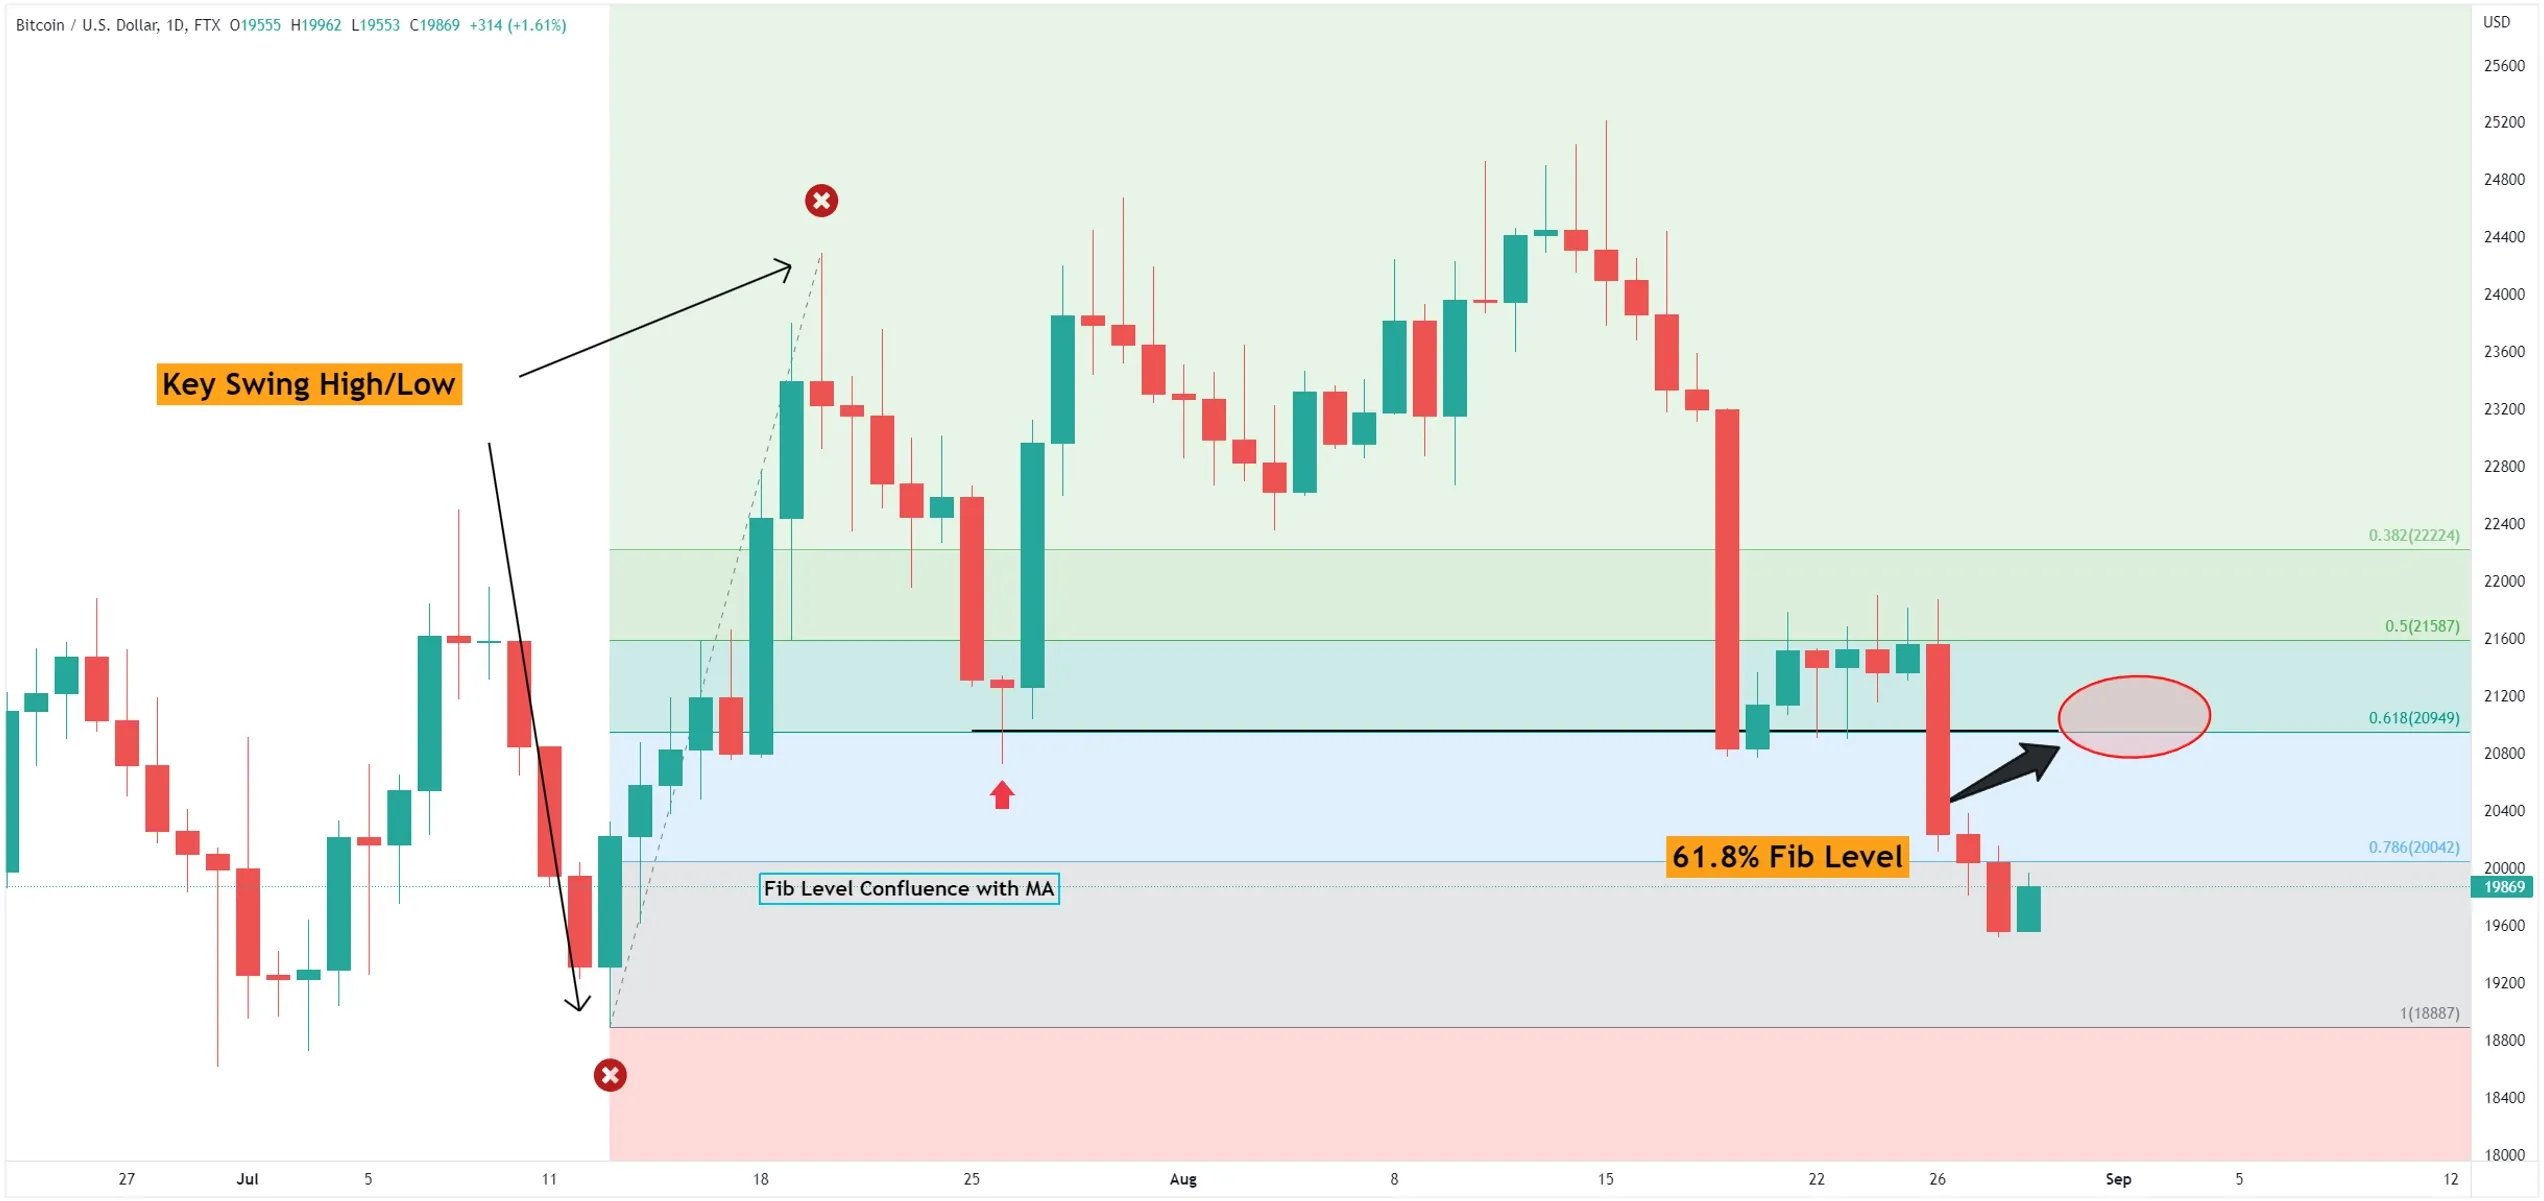
Learning about advanced patterns like the Fibonacci retracements and extensions can help you find possible support and resistance levels using the golden ratio. Fibonacci analysis applies mathematical ratios derived from the Fibonacci sequence to identify potential price levels where reversals or continuations might occur.
To use Fibonacci retracement, traders look for a big price swing, either from high to low or low to high. They then find the distance and break it down using key Fibonacci ratios: 23.6%, 38.2%, 50%, 61.8%, and 100%. These levels often act as support during uptrends or resistance during downtrends, providing traders with specific price targets for entries, exits, or stop-loss placement.
Fibonacci extensions project potential price targets beyond the current trend. After identifying a significant price swing and retracement, traders use extension levels (typically 127.2%, 161.8%, and 261.8%) to estimate where prices might reach if the trend resumes. These extensions prove particularly valuable in cryptocurrency markets, where parabolic moves can carry prices far beyond traditional technical analysis expectations.
Time Frame Analysis and Multiple Chart Perspective
Successful cryptocurrency trading requires analyzing multiple time frames to understand both short-term opportunities and long-term trends. The general rule suggests using a higher time frame to identify the overall trend direction, an intermediate time frame for timing entries and exits, and a lower time frame for precise execution.
For example, swing traders might analyze weekly charts to identify major trend direction, daily charts to pinpoint entry opportunities, and hourly charts to execute trades with optimal timing. This approach helps avoid the common mistake of fighting the major trend while scalping in the opposite direction of longer-term momentum.
The concept of time frame confluence occurs when signals align across multiple time frames, providing higher probability trading opportunities. When daily, weekly, and monthly charts all suggest bullish momentum, any pullback to support levels represents a higher probability buying opportunity than signals appearing on only one time frame.
Volume Analysis and Market Sentiment
Trading volume provides crucial insights into the conviction behind price movements. High volume during price advances suggests strong buying interest and increases the likelihood of continued upward movement. Low volume during rallies might indicate weak buying interest and higher probability of reversal.
Volume spikes often precede significant price movements in cryptocurrency markets. When Bitcoin or other major cryptocurrencies experience unusual volume increases, it typically signals that important news or technical developments are driving increased trader interest. These volume spikes can provide early warnings of impending price volatility.
Volume divergence occurs when price and volume move in opposite directions, often signaling potential trend changes. If cryptocurrency prices reach new highs while volume decreases, it suggests weakening buying interest despite higher prices. Conversely, if prices make new lows while volume decreases, it might indicate that selling pressure is diminishing.
Risk Management and Position Sizing
Risk management: Always implement risk management strategies, such as setting stop-loss orders, when trading based on chart patterns to protect against false signals. Technical analysis provides tools for identifying trading opportunities, but proper risk management determines long-term trading success.
Stop-loss orders represent the most fundamental risk management tool, automatically closing positions when prices move against your analysis. In cryptocurrency markets, stop-losses should account for typical volatility levels to avoid premature execution during normal price fluctuations. Many successful traders place stop-losses just beyond significant support or resistance levels, giving their positions room to breathe while limiting potential losses.
Position sizing determines how much capital to risk on each trade based on your analysis confidence and overall portfolio management strategy. A common approach involves risking no more than 1-2% of total trading capital on any single trade, regardless of confidence level. This approach ensures that even a series of losing trades won't significantly damage your overall trading account.
Take-profit levels help lock in gains when prices reach your analysis targets. Many traders use a risk-reward ratio approach, seeking profits that are at least twice as large as their potential losses. This approach means that even with a 50% win rate, traders can remain profitable over time.
Advanced Concepts and Market Psychology
Understanding market psychology helps interpret technical analysis signals within broader context. Fear and greed drive most market movements, creating recurring patterns that technical analysis helps identify. During bull markets, traders become increasingly optimistic, often ignoring negative signals and focusing only on bullish patterns. Conversely, bear markets create pessimism that can cause traders to ignore legitimate bullish signals.
Market cycles in cryptocurrency follow predictable psychological patterns. Accumulation phases occur when informed traders quietly build positions while general market sentiment remains negative. Public participation phases see increasing mainstream interest and media coverage. Distribution phases happen when experienced traders begin selling to enthusiastic newcomers. Decline phases feature widespread pessimism and capitulation selling.
Sentiment analysis complements technical analysis by providing insights into overall market mood. Market sentiment: Look at social media or news to gauge how the community feels about the crypto. Social media sentiment, news coverage tone, and options market data provide additional context for interpreting technical analysis signals.
Practical Application and Trading Strategies
You'll need a mix of all of the methods in this article to analyze crypto markets and trading. An example workflow for crypto trading analysis might include: Research: Conduct fundamental analysis by studying the project, its news, and developments. Market sentiment: Look at social media or news to gauge how the community feels about the crypto. Technical analysis: Open a chart and analyze the price using indicators like RSI, MACD, and trend lines. On-chain data: Check on-chain metrics for potential market moves.
Developing a systematic approach to chart analysis helps maintain consistency and objectivity in trading decisions. Begin each analysis session by identifying the major trend direction on higher time frames. Next, look for significant support and resistance levels that might impact price movement. Then examine candlestick patterns and technical indicators for entry and exit timing.
Technical Indicators: Use a combination of indicators for more accurate predictions. Chart Patterns: Identify key patterns that signal trend reversals. Risk Management: Always use stop-loss orders to limit potential losses. Combining multiple analytical approaches increases signal reliability while reducing false signal frequency.
Backtesting your analytical approach provides valuable insights into strategy effectiveness. Review historical charts to identify how your chosen patterns and indicators would have performed in various market conditions. This process helps refine your analytical skills and builds confidence in your trading approach.
Common Mistakes and How to Avoid Them
New cryptocurrency traders often make predictable mistakes that proper education can help avoid. Over-reliance on single indicators represents one of the most common errors. No single technical indicator provides consistently accurate signals in all market conditions. Successful traders combine multiple indicators and analytical approaches for signal confirmation.
Analysis paralysis occurs when traders attempt to use too many indicators simultaneously, creating conflicting signals and decision-making difficulties. Focus on mastering a few indicators rather than trying to use every available tool. Start with basic trend identification, support and resistance levels, and one or two momentum indicators.
Ignoring market context leads to poor trading decisions even when technical analysis appears clear. A perfect bullish setup on a lower time frame means little if major cryptocurrency news or broader market conditions suggest bearish pressure. Always consider fundamental factors and market sentiment alongside technical analysis.
Emotional trading undermines even the best technical analysis. Fear causes traders to exit profitable positions too early, while greed leads to holding losing positions too long. Develop and follow a systematic trading plan that includes predetermined entry, exit, and risk management rules.
The Evolution of Crypto Technical Analysis
Technical analysis continues evolving as cryptocurrency markets mature and new analytical tools emerge. A relatively new but intriguing formation, the Three Blind Mice pattern captured the attention of traders in 2024 when it emerged on Bitcoin's chart. As markets develop, new patterns and analytical approaches emerge to help traders adapt to changing conditions.
Algorithmic trading and artificial intelligence increasingly influence cryptocurrency markets, potentially affecting traditional technical analysis effectiveness. However, human psychology remains a constant factor in market behavior, ensuring that classical technical analysis principles retain relevance even as markets evolve.
Building Your Technical Analysis Expertise
It is best to try your chart reading skills on a demo account before you start real trading so you can hone your skills without losing money. Practice with paper trading or demo accounts allows you to test your analytical skills without financial risk while building confidence in your approach.
Remember, the more you learn about technical analysis and chart reading, the better your chances of success in the crypto market. Continuous education through books, courses, and market observation helps refine your analytical skills over time. Markets constantly evolve, requiring ongoing learning and adaptation.
Consider keeping a trading journal to document your analytical decisions and their outcomes. Recording your reasoning for each trade, including chart screenshots and analysis notes, provides valuable data for improving your approach over time. Review both successful and unsuccessful trades to identify patterns in your decision-making process.
Conclusion: Mastering the Art and Science of Chart Reading
Learning to read cryptocurrency charts effectively combines analytical skill with psychological discipline. By applying the principles of technical analysis, you can gain a better understanding of market trends, make informed decisions, and potentially maximize profits. Success requires patience, practice, and continuous learning as markets evolve and new analytical techniques emerge.
Technical analysis provides a structured approach to understanding market behavior, but it's not infallible. Research into the reliability of candlestick patterns suggests that they do have some predictive value, but as with all trading strategies, their efficacy is likely dependent on various factors. Combine technical analysis with proper risk management, fundamental understanding, and realistic expectations for the best long-term results.
The cryptocurrency market offers unique opportunities for those willing to develop proper analytical skills. Unlike traditional markets with limited trading hours, crypto markets operate continuously, providing constant opportunities to practice and refine your chart reading abilities. Start with basic concepts, master fundamental patterns and indicators, then gradually incorporate more advanced techniques as your experience grows.
Remember that successful trading involves much more than pattern recognition. It requires disciplined execution, proper risk management, emotional control, and continuous adaptation to changing market conditions. Use technical analysis as one component of a comprehensive trading approach that includes fundamental analysis, risk management, and psychological discipline.
The journey to mastering cryptocurrency chart analysis takes time and dedication, but the skills you develop will serve you throughout your trading career. Begin with paper trading to practice your skills risk-free, gradually transition to small position sizes as confidence builds, and always maintain focus on long-term skill development rather than short-term profits. With patience and persistence, technical analysis can become a valuable tool in your cryptocurrency trading toolkit.