


As I pointed out in last week's analysis, the bearish scenario for Bitcoin remained the most likely one. The market did continue its correction and is now approaching an important technical area. At the same time, ETF flows are still too weak to speak of a genuine return of institutional conviction. On the Ondo side, the excitement that followed the SBI announcement attracted many retail investors, which makes me even more focused on patience and discipline when choosing my entries.
Bitcoin: The Bearish Scenario Remains Intact Until Resistance Is Reclaimed
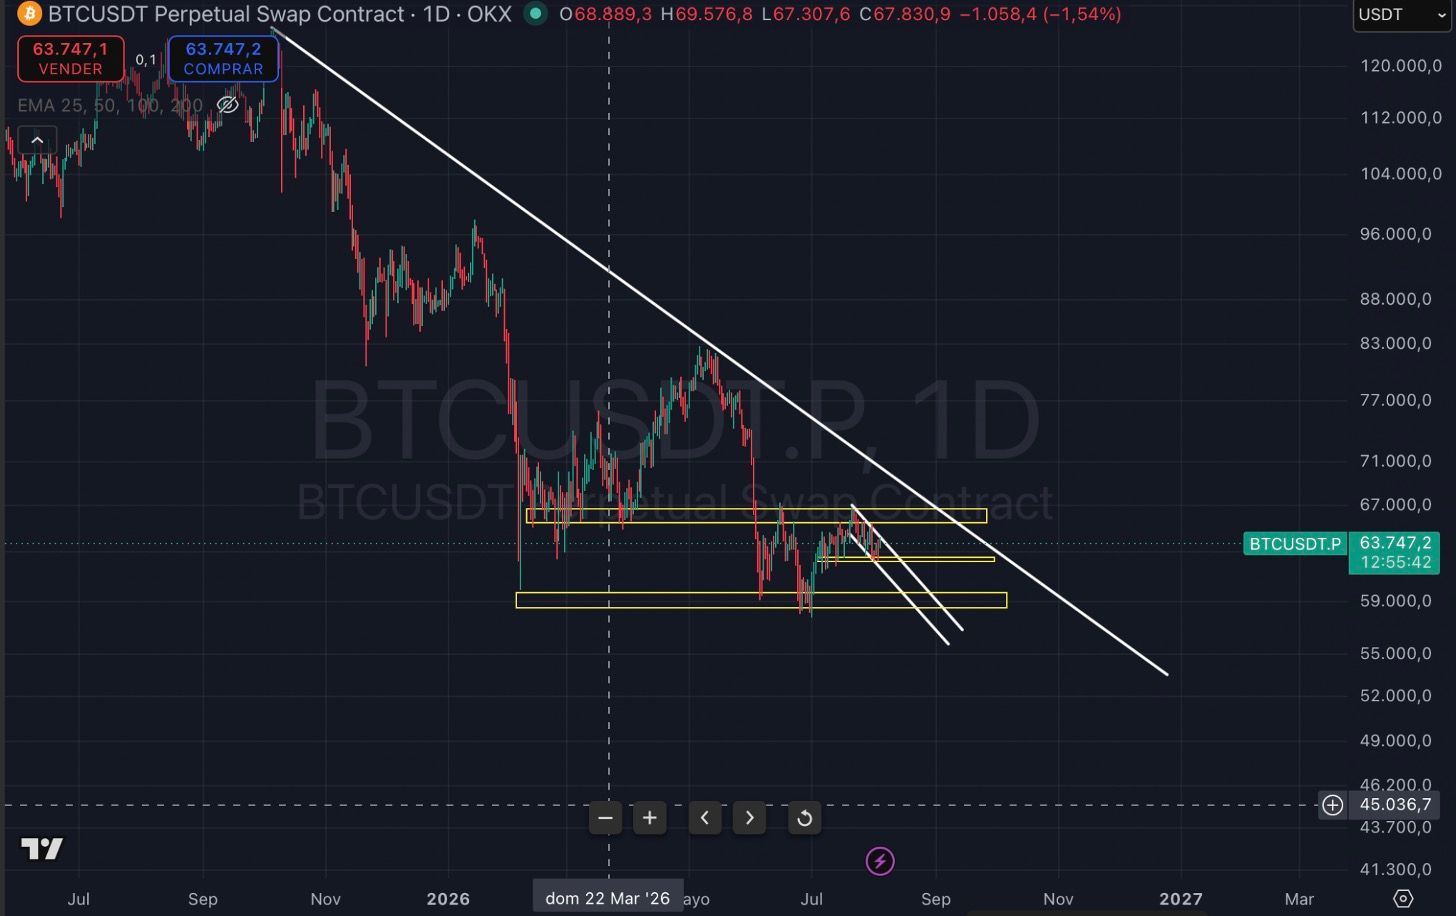
As I mentioned in last week's analysis, Bitcoin was moving toward the $60,000 area. So far, that scenario has played out quite cleanly. Price came down to test the $62,200-$62,500 zone, which is currently one of the most important short-term support areas in the market. For now, this is the zone preventing a more decisive move toward $60,000 and then the $58,000-$59,000 region.
If we take a step back and look at the daily chart, the picture remains clear: Bitcoin is still trading within a bearish structure. Highs are getting lower, rebounds lack strength, and sellers still control the broader trend. That does not mean a bounce is impossible. It simply means that, from a macro perspective, there is still no signal strong enough to confirm a lasting reversal.
As long as price remains above the $62,200-$62,500 zone, a technical rebound can still develop. However, a clean break below this support would, in my view, open the door to a faster move toward $58,000-$59,000. That would be the next area I would watch very closely because it has already supported the market in the past and could once again attract buyers. As I have explained in previous analyses, any move that takes Bitcoin below $65,000 looks attractive to me for gradually building a long-term position through a DCA strategy. Nobody can identify the exact bottom with certainty. The goal is not to guess the perfect price, but to accumulate at levels that, in my opinion, remain attractive from a long-term perspective.
Bitcoin daily chart: bearish structure and major support zones.
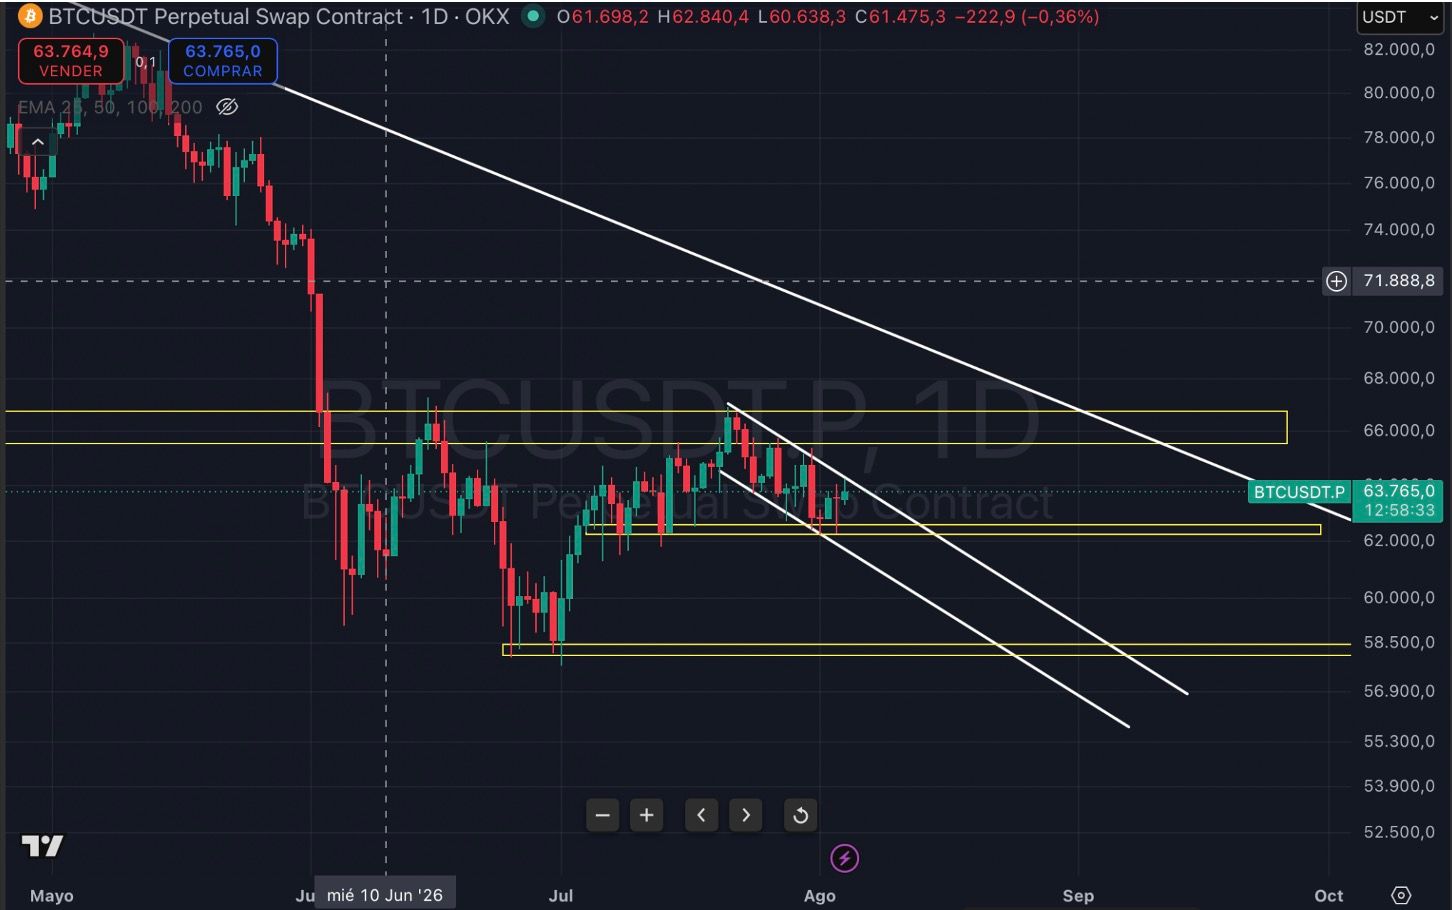
A closer look at the $62,200-$62,500 area, the key short-term support zone.
The Four-Hour Chart Confirms That the Bearish Channel Still Dominates
Here I am showing the four-hour chart. You can clearly see the bearish channel in which Bitcoin has been trading for several sessions. Price came down to touch the $62,250 area before producing a slight rebound, but that rebound did not invalidate the bearish structure. In other words, Bitcoin is bouncing, but it is still doing so inside a technical framework that remains unfavorable.
This is important because many investors are too quick to interpret every bounce as a recovery signal. I prefer to stick to what the chart is actually showing: as long as price continues to respect this descending channel, the bias remains bearish. The $62,250 area therefore continues to play a central role as support, and we will need to watch how the market behaves over the coming sessions. If this level breaks, selling pressure could accelerate quickly.
In summary, I remain bearish on Bitcoin in the short term. To consider a more constructive scenario, price would at least need to reclaim the upper resistance zones on a sustained basis and break cleanly out of this descending structure.
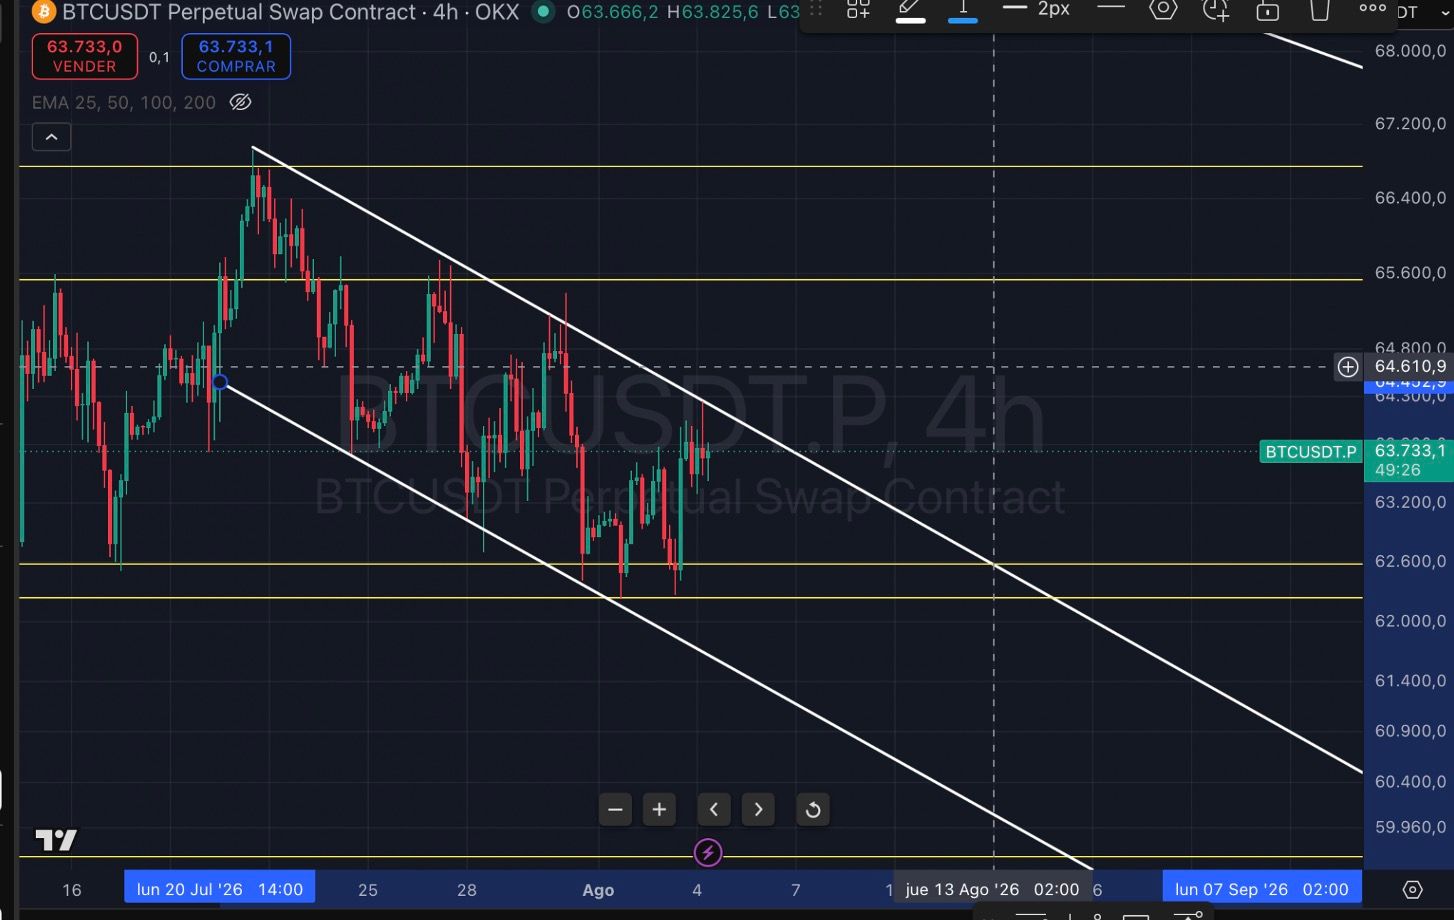
Bitcoin four-hour chart: a bounce from $62,250, but still inside a bearish channel.
Bitcoin ETFs Show Some Buying, but Still No Real Conviction
If we look at spot Bitcoin ETF flows, the message also remains cautious. Since July 23, selling and capital outflows have generally been more significant than the purchases seen before that date. The beginning of August does show a slight return of inflows, but the amounts remain modest and do not resemble what we normally see during genuine phases of institutional accumulation.
In simple terms, some buying is returning, but nothing strong enough to say that large institutional players are back aggressively. To change my view, I would need to see several consecutive sessions with clearly stronger flows, capable of confirming a sustained return of institutional demand. For now, ETF activity does not invalidate my main scenario: the market remains fragile and could still experience another leg lower.
Ondo: FOMO Has Returned, but Patience Remains the Best Strategy
I now want to talk about Ondo, an asset I continue to follow closely. You may remember that I started buying Ondo around $0.30, before the SBI-related announcement a few days ago. Immediately after that announcement, we saw the classic crypto market pattern: many retail investors rushed into the asset, driven by FOMO, the headlines, and the fear of missing an opportunity.
That is exactly why I often repeat that an investment should be built when almost nobody is talking about the project. The best opportunities rarely appear when everyone is already excited. Ondo had spent a long period accumulating sideways on the daily chart while receiving relatively little attention. Price then broke out of its bearish channel, triggering a rapid move higher.
The important point to watch now is not a supposed perfect resistance level, but how price behaves around $0.37. If Ondo closes below this level, a new corrective phase could quickly take price back toward the $0.30-$0.32 area. That is the zone I will continue to monitor because it could offer another accumulation opportunity if the market confirms solid support there.
For my part, I decided to take profits on the spot position I opened around $0.30 because I believe there is a real chance to rebuild the position below the price at which I sold. In my view, it is often better to anticipate, secure profits, and then wait until retail investors step away and the market clears out the excess euphoria. That is how wealth can be built: buying when pessimism dominates, not when everyone is already chasing the move.