


Bitcoin(BTC) has corrected again and, as often happens in this market, a decline of around 5% has been enough for fear to return.
But it is important to put the move into context.
In my previous analysis, I explained that despite the strong impulse that took Bitcoin from the $60,000 area to almost $80,000, I still did not consider the market to be structurally bullish. For that to change, Bitcoin needed to break and consolidate above the $82,000-$84,000 area.
That did not happen.
Bitcoin approached that resistance, selling pressure appeared, and we are now seeing a correction. Is that worrying? In my view, no. It is completely normal.
Markets do not move in straight lines. They move through impulses and retracements. After a move of almost $20,000 from the recent lows, a correction was far more logical than expecting Bitcoin to continue rising vertically.
$76,000 Becomes the Key Area
If we look at the daily chart, Bitcoin may now be entering a new consolidation range.
The $76,000 area is particularly interesting. It is not only acting as short-term support, but it also corresponds to a relevant former price area from April 2026.
Above price, the first important resistance sits around $79,000-$80,000.
My base case for the next few days is therefore relatively simple: I would not be surprised to see Bitcoin enter a quieter, more boring period, moving roughly between $76,000 and $80,000 while the market digests the latest impulse.
That would be completely healthy.
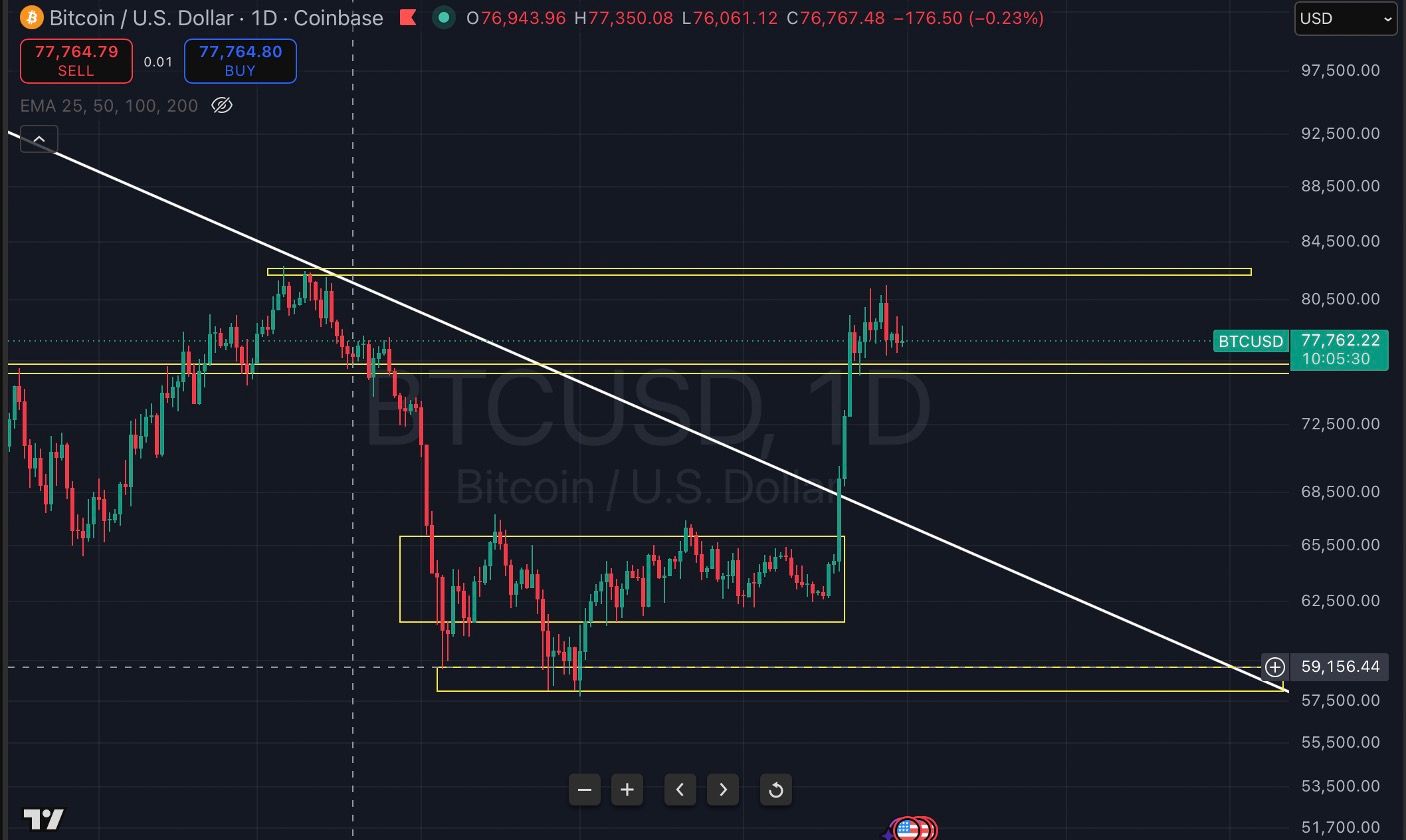
Bitcoin / U.S. Dollar, daily chart. Key support and resistance areas highlighted.
Will Bitcoin Eventually Break $82,000?
I believe it will.
I still expect Bitcoin to eventually attack and break through the $82,000-$84,000 area, but that does not mean it has to happen immediately.
In fact, from a market-structure perspective, it could be healthier to first see a temporary move below $76,000. Why? Because after such a strong move higher, leveraged long positions have accumulated again. A move below support could sweep liquidity, liquidate part of those longs and clean up excess leverage before the market attempts another sustained move higher.
A break below $76,000 would therefore not automatically invalidate the broader constructive scenario. What matters would be how that loss of support occurs, where demand returns and, most importantly, whether Bitcoin is subsequently able to reclaim the level.
ETF Flows Continue to Send an Important Signal
One of the most interesting pieces of the current picture comes from spot Bitcoin ETF flows.
Looking at the August data shown below, the picture is very different from the fear currently visible among many retail investors. After net outflows between 12 and 14 August, flows turned decisively positive. Every session shown from 17 through 27 August finished with positive net inflows.
The strongest days included approximately $517.2 million of net inflows on 19 August and $606.3 million on 20 August. Further positive sessions followed, including roughly $307.5 million, $337.6 million, $314.3 million, $232.2 million and $242.3 million.
On 28 August, however, the data shows a net outflow of approximately $201.9 million.
So it would not be accurate to say that ETFs bought every single day throughout August. The more important point is that the second half of the month showed substantial net institutional demand.
These flows remain one of the most important variables to monitor because institutional ETF demand has become a major source of marginal buying pressure in the Bitcoin market.
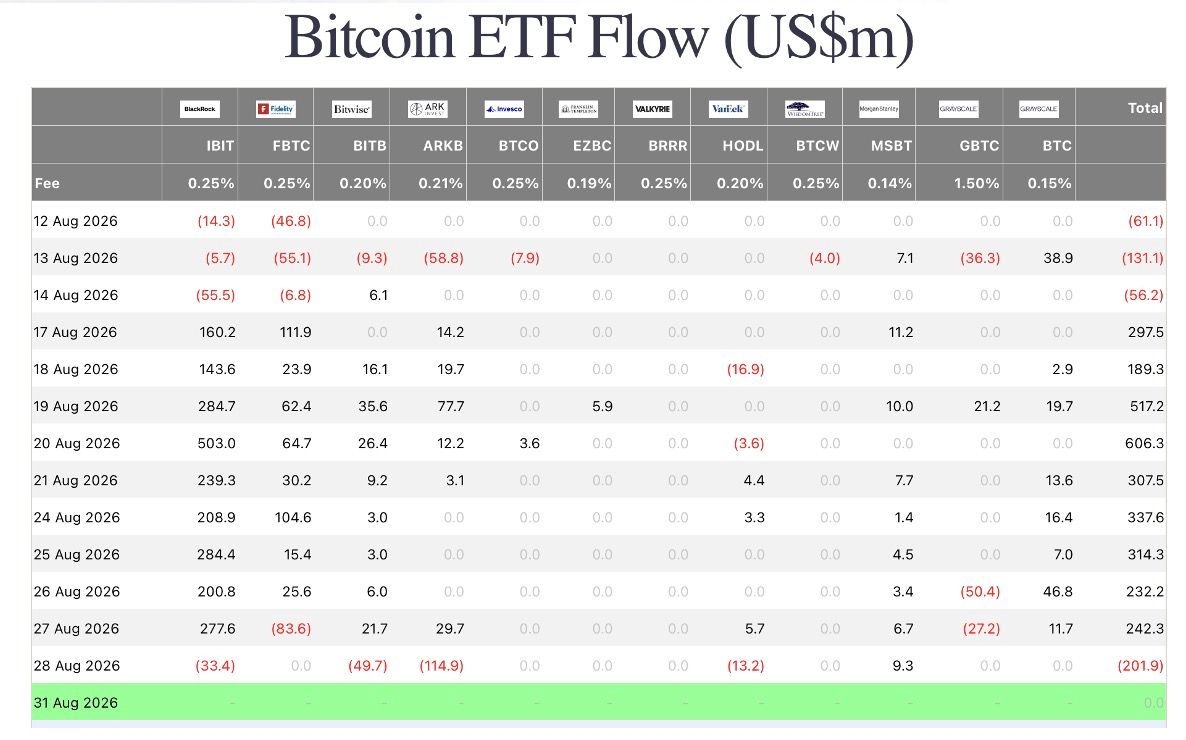
Bitcoin ETF flows (US$m), August 2026.
Bitcoin Corrects 5% and Everyone Panics
One of the things that continues to surprise me about Bitcoin is how quickly market sentiment changes.
When Bitcoin was trading near $60,000, many investors were afraid to buy. Then Bitcoin rallied almost $20,000 and FOMO returned. Now the market corrects around 5% and panic appears again.
But a 5% move in Bitcoin is not extraordinary. In the context of the recent rally, it is little more than a normal retracement.
My view remains straightforward: the recovery from the lows has been important and the break of the previous bearish structure is constructive, but Bitcoin still has a major resistance zone ahead.