
Ethereum's trading activity on Binance has surpassed $6 trillion in 2025, a figure roughly two to three times higher than in previous market cycles. This staggering number reflects more than simple growth. It signals a fundamental shift in how crypto markets function, driven increasingly by speculation, leverage, and derivatives rather than the organic spot trading that characterized earlier bull runs.
According to CryptoQuant analyst Darkfost, the Ethereum market is now "driven by speculation more than ever before, as traders pursue quick returns rather than sustainable growth." This transformation has created a far less stable trading environment, where volatility and leverage increasingly shape price action. Meanwhile, open interest on Binance hit $12.5 billion in August 2025, representing a fivefold increase compared to the previous all-time high of $2.5 billion in November 2021.
These numbers matter because trading volume serves as the lifeblood of any financial market. It reveals who is buying and selling, at what pace, and with what conviction. But in crypto, where derivatives now account for roughly 79% of total trading activity, volume statistics have become both more important and more complex to interpret. High volume can signal genuine interest and healthy liquidity, but it can also mask wash trading, reflect leveraged speculation, or indicate an impending liquidation cascade.
Below we explain what trading volume actually means in cryptocurrency markets, how it is measured and reported, why the surge in Ethereum's trading activity reveals troubling patterns about market structure, and what traders and investors should understand about the relationship between volume, price discovery, and market health.
What Is Trading Volume? Definition and Basics
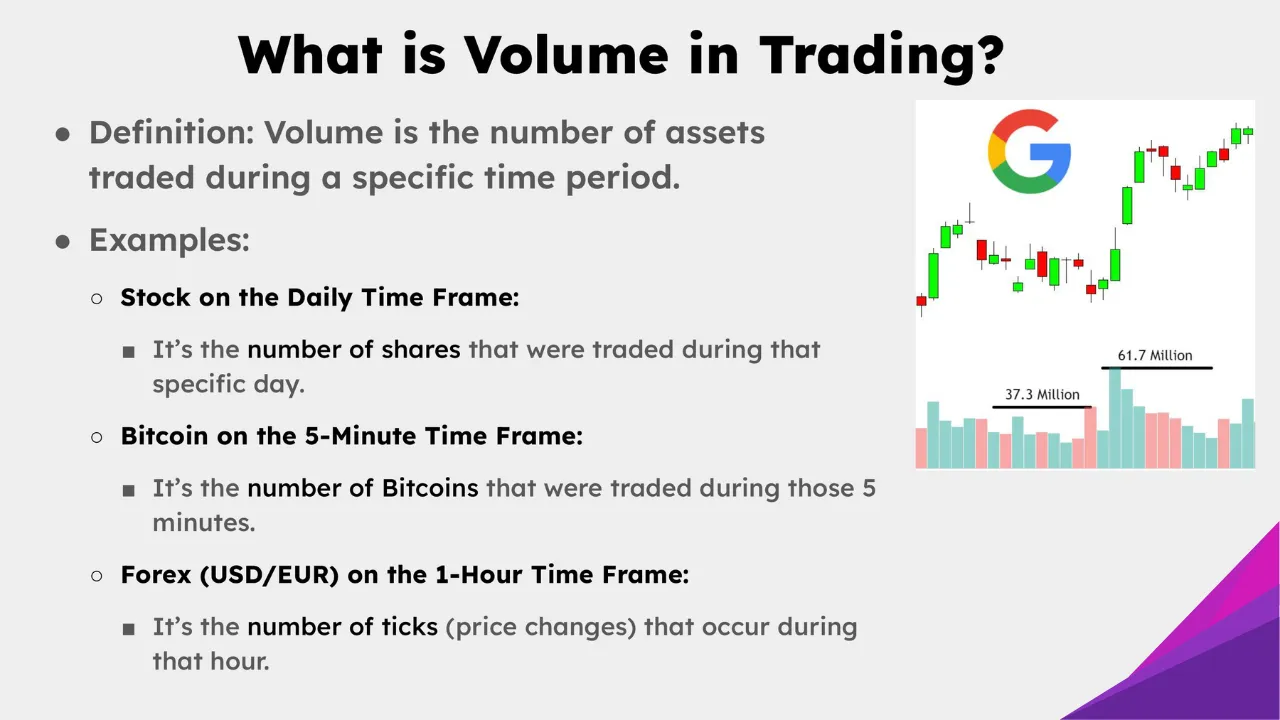
Trading volume represents the total amount of an asset that changes hands during a specified period, typically measured over 24 hours in crypto markets. Unlike traditional financial markets with defined opening and closing times, cryptocurrency exchanges operate continuously, creating unique challenges for volume calculation and interpretation.
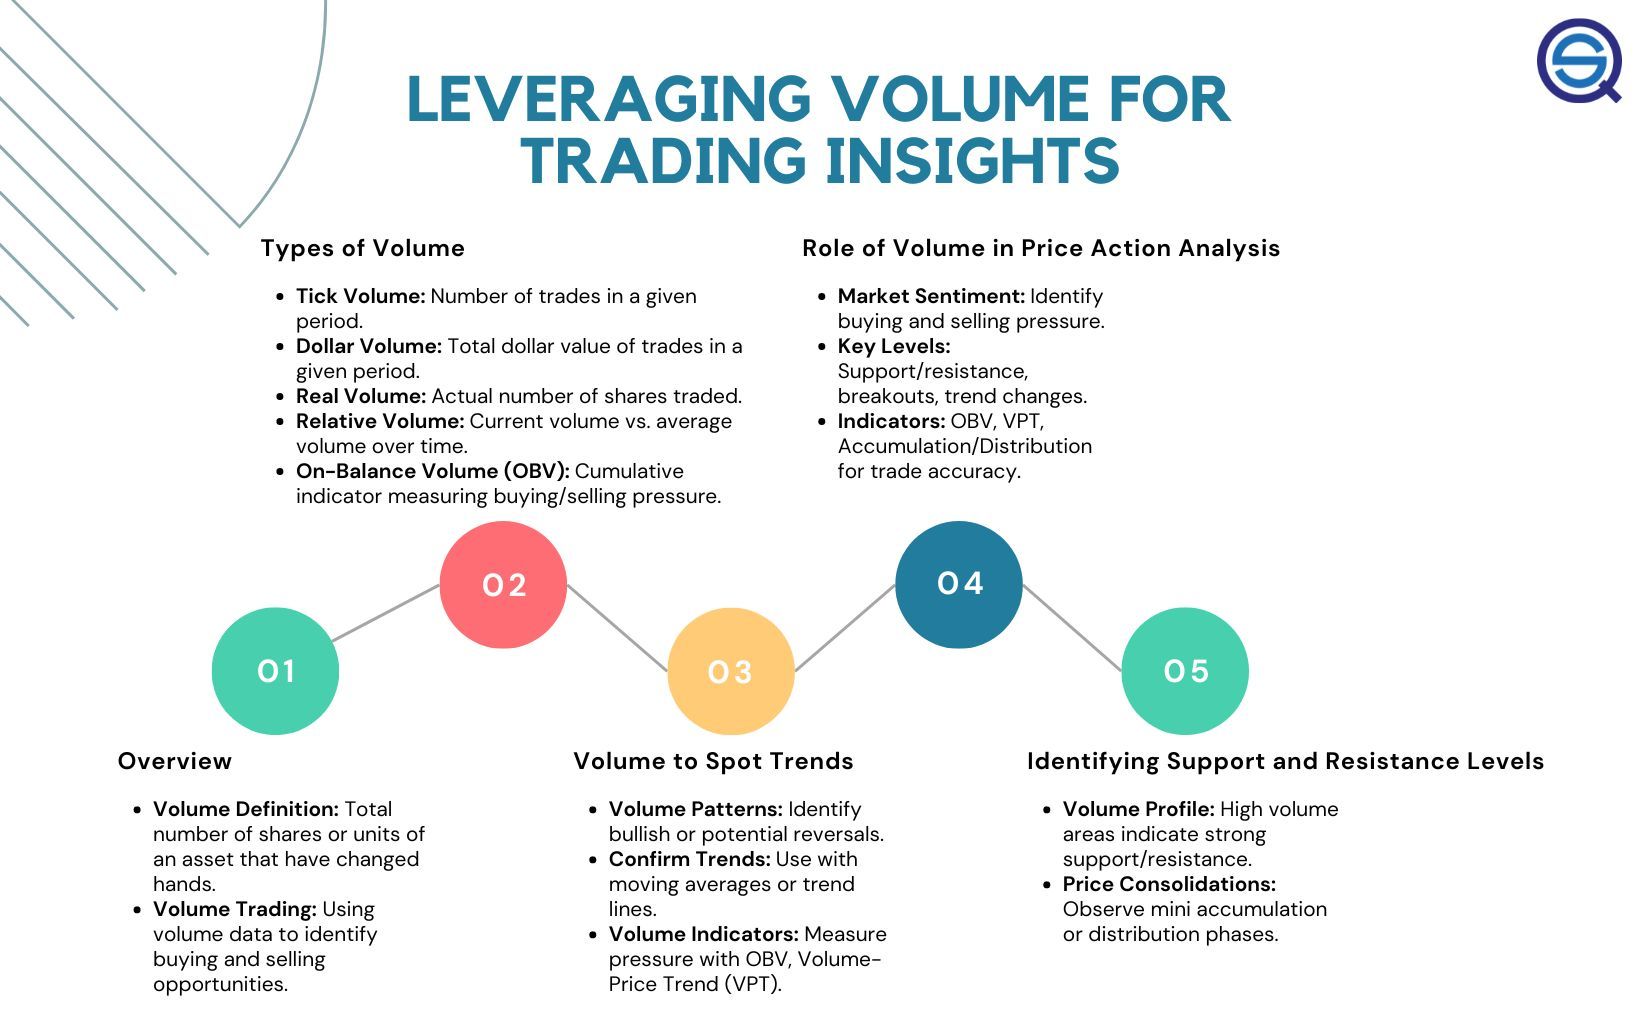
In crypto, volume can be measured in multiple ways. The most common metric is notional volume, which represents the total dollar value of all trades executed. If 100 Bitcoin are traded at an average price of $100,000 each, the notional volume would be $10 million. However, exchanges and data aggregators also track trade count (the number of individual transactions), unique active addresses, and the actual quantity of coins moved.
Order book depth provides a related but distinct concept. While volume measures past trades, depth measures the quantity of buy and sell orders waiting at various price levels. An exchange might show high historical volume but thin order books, meaning large orders could still cause significant price slippage. This distinction matters particularly in crypto, where liquidity can fragment across dozens of venues.
Trading volume differs fundamentally from transaction count. A single large institutional trade might represent millions of dollars in volume but only one transaction. Conversely, thousands of small retail trades could generate numerous transactions while producing modest total volume. Binance processes an average of $30 billion in daily trades, but this reflects a mix of institutional block trades, algorithmic market making, retail speculation, and automated trading systems.
Most major exchanges report volume figures publicly, which are then aggregated by platforms like CoinMarketCap, CoinGecko, and The Block. However, these self-reported numbers have historically proven unreliable. Research has consistently found that a significant portion of reported crypto exchange volume is fabricated through wash trading, where the same entity executes both buy and sell orders to create the illusion of activity.
The challenge becomes more complex when distinguishing between spot and derivatives volume. Spot volume represents actual cryptocurrency changing hands, while derivatives volume reflects contracts whose value derives from an underlying asset. Since one Bitcoin could theoretically underpin unlimited derivative contracts, derivatives volume often dwarfs spot volume despite representing claims on the same finite supply of coins.
Spot vs. Derivatives Volume: What's Driving the Market Today
The crypto market's evolution from spot-dominated to derivatives-dominated trading marks perhaps its most significant structural transformation. While Bitcoin and Ethereum spot volumes remain substantial, perpetual contracts now account for approximately 78% of total crypto derivatives trading volume, and derivatives overall represent roughly 79% of all crypto market activity.
Perpetual futures, or "perps," differ from traditional futures by never expiring. Instead of settling on a fixed date, these contracts use a funding rate mechanism settled every eight hours to keep prices aligned with spot markets. When perpetuals trade above spot, long holders pay short holders; when they trade below, shorts compensate longs. This continuous rebalancing allows indefinite position holding while theoretically preventing excessive divergence from underlying asset prices.
The dominance of derivatives trading reflects several converging factors. First, derivatives enable leverage, allowing traders to control positions far larger than their capital base. Platforms regularly offer 100x leverage, meaning a trader can control $100,000 worth of Bitcoin with just $1,000. This magnification appeals to speculators seeking amplified returns but creates systemic fragility.
Second, derivatives markets provide sophisticated hedging tools previously unavailable in crypto. Miners can lock in future selling prices, protecting against downside volatility. Market makers can manage inventory risk more efficiently. Institutional investors increasingly use derivatives for exposure management rather than accumulating spot holdings, as evidenced by Bitcoin and Ethereum futures recording 26% year-over-year growth.
The data on Ethereum's 2025 activity illustrates this shift starkly. While the $6 trillion in trading volume on Binance seems to suggest robust market health, context reveals a different picture. This volume comes primarily from perpetual swaps and futures rather than spot accumulation. The $12.5 billion in open interest represents leveraged positions, not actual Ethereum held in wallets.
Leverage and funding rates create feedback loops that amplify volatility. When Bitcoin surged to record highs in October 2025, over $19 billion in leveraged positions were liquidated in a 24-hour period, affecting more than 1.6 million traders. These cascading liquidations occurred as falling prices triggered margin calls, forcing automatic position closures that drove prices lower still, triggering additional liquidations in a self-reinforcing spiral.
The October crash demonstrated how derivatives-driven volume differs from spot-based market activity. Bitcoin fell 17.2% while open interest dropped over 30%, revealing that much of the preceding price action reflected leveraged speculation rather than sustainable demand. Once leverage unwound, prices corrected sharply.
This dynamic creates a market environment where short-term price movements become increasingly decoupled from fundamental value drivers. A derivatives-dominated market responds to technical factors like funding rates, liquidation levels, and options expiry dates as much as to adoption metrics, development progress, or macroeconomic conditions.
Exchange Dominance and Liquidity Concentration
Market structure in crypto remains remarkably concentrated despite the proliferation of trading venues. Binance maintained a 35-39.8% market share throughout 2025, processing approximately $2.06 trillion in Q3 spot trading volume. This dominance extends across both spot and derivatives markets, where Binance commands 24.61% of total open interest.
Concentration of liquidity on a single platform creates both benefits and risks. On the positive side, concentrated liquidity typically means tighter spreads and better execution for traders. Large orders can be filled with minimal price impact when depth exists. Market makers concentrate operations where volume flows, creating self-reinforcing liquidity.
However, excessive concentration introduces single points of failure. When Binance increased its market dominance to nearly 50% during periods of market stress in April 2025, the exchange effectively became systemically important. Technical issues, regulatory actions, or internal problems at Binance would disproportionately impact global crypto markets.
The maker-taker model employed by most exchanges creates additional complexity. Makers provide liquidity by placing limit orders on the order book, while takers remove liquidity by executing market orders. Exchanges typically charge takers higher fees while rebating makers, incentivizing market-making activity. However, this structure can enable fee-tier gaming where traders wash trade to achieve volume discounts.
Smaller exchanges and decentralized venues occupy distinct market niches. Decentralized exchanges (DEXs) now hold 21.7% market share, up from negligible levels just years ago. Platforms like Uniswap and dYdX offer non-custodial trading, appealing to users who prioritize control over their assets. However, DEX liquidity typically remains orders of magnitude smaller than major centralized exchanges, resulting in wider spreads and higher slippage for large trades.
The concentration extends beyond platforms to specific trading pairs and assets. Bitcoin and Ethereum account for over 61% of all trading volume across exchanges, leaving thousands of altcoins trading in relative obscurity. This concentration creates a hierarchy where major assets benefit from deep liquidity while smaller tokens suffer from fragmented, thin markets prone to manipulation.
Slippage, the difference between expected and executed trade prices, varies dramatically based on liquidity concentration. A $10 million Bitcoin market order on Binance might experience minimal slippage given the platform's depth. The same order for a mid-cap altcoin could move the market 5-10%, dramatically affecting execution quality.
How Volume Influences Price Discovery
Price discovery, the process through which markets determine asset values, depends critically on trading volume. In theory, higher volumes lead to more efficient price discovery by incorporating diverse participant views and reducing the influence of individual traders. However, crypto markets demonstrate that volume quantity matters less than volume quality.
Genuine trading volume improves price discovery through several mechanisms. First, more transactions mean more information incorporated into prices. Each trade represents a participant's assessment of fair value at that moment. Aggregating thousands of assessments should theoretically approach true value more closely than a handful of trades.
Second, higher volumes typically correlate with tighter bid-ask spreads. When many participants actively trade, competition between market makers narrows the spread between buying and selling prices. Tight spreads reduce transaction costs and make prices more continuous rather than jumping between discrete levels.
Third, volume provides liquidity, allowing large players to enter or exit positions without dramatically moving prices. This depth encourages participation from sophisticated investors whose capital and analysis could improve price accuracy. Thin markets, conversely, see prices whipsaw on modest order flow.
However, these benefits depend on volume authenticity. Wash trading, where the same entity executes both sides of trades, creates the illusion of volume without genuine price discovery. Research suggests over 70% of volume on unregulated exchanges consists of wash trades, while even conservative estimates place fake volume between 25-50% on many platforms.
The Bitwise Asset Management report presented to the SEC estimated that roughly 95% of reported Bitcoin trading volume was fake. While this figure likely overstates the problem on major regulated venues, it highlights systemic issues with self-reported data. Exchanges have strong incentives to inflate volume since higher reported volumes attract users seeking liquid markets and enable exchanges to charge higher token listing fees.
Detecting wash trading requires analyzing trading patterns rather than trusting headline numbers. Legitimate trading typically exhibits certain characteristics: trades cluster around round numbers due to human psychology, trade sizes follow power law distributions with many small trades and few large ones, and trading volume correlates with web traffic and social media activity. Wash trading shows opposite patterns: abnormally smooth distributions, lack of round number clustering, and volume disconnected from genuine engagement metrics.
Recent enforcement actions have targeted this manipulation. In October 2024, the SEC charged four market makers for generating artificial token trading volume, revealing an international scheme involving 18 individuals across multiple jurisdictions. Such actions represent growing regulatory attention to market manipulation, though enforcement remains inconsistent.
Even on legitimate venues, volume quality varies. Retail panic selling during crashes generates high volume but may not reflect rational price discovery. Algorithmic trading and high-frequency strategies can inflate volumes while adding minimal information. Bot activity particularly affects smaller tokens, where services like Volume.li sell wash trading as a service, generating thousands of fake trades to boost token visibility.
The implication for price discovery is that volume alone reveals little about market efficiency. Analysts must consider volume source, trading patterns, and external factors to assess whether high volumes indicate genuine interest or manufactured activity designed to mislead.
What Ethereum's $6 Trillion Volume Reveals About 2025 Markets
The unprecedented Ethereum trading volume on Binance serves as a case study in modern crypto market structure. While the $6 trillion figure seems to indicate extraordinary interest in Ethereum, deeper analysis reveals concerning patterns about speculation, leverage, and market fragility.
First, this volume arrived during a period of price recovery rather than organic growth. Ethereum reclaimed levels around $3,500-3,700 in late 2025, but the trading activity driving this recovery looked fundamentally different from previous bull cycles. In 2020-2021, spot accumulation dominated as investors bought and held ETH. In 2025, derivatives speculation drives volume as traders bet on short-term price movements.
The $12.5 billion in open interest, a fivefold increase from the 2021 peak, reveals the extent of leveraged positioning. Open interest measures the total value of outstanding derivative contracts, indicating how much capital sits in leveraged positions. This metric's dramatic growth suggests traders are increasingly using borrowed funds to amplify exposure rather than buying spot Ethereum.
This shift carries several implications. Leveraged positions face liquidation if prices move adversely, creating potential for cascades where forced selling triggers additional liquidations. The October 2025 liquidation event, which wiped out $19 billion in positions, demonstrated this vulnerability. While that event primarily affected Bitcoin, similar dynamics threaten any highly leveraged market.
Additionally, derivatives-driven rallies tend to be more fragile than spot-driven ones. Spot buyers signal conviction, typically holding through volatility. Derivatives traders often employ shorter timeframes, quickly reversing positions. Research shows that 81% of derivatives positions close within 24 hours, indicating speculative rather than investment intent.
The concentration of Ethereum trading on Binance adds another layer of concern. While Binance's market dominance reflects its liquidity advantages, it also means Ethereum price action depends heavily on a single platform's dynamics. Issues specific to Binance, whether technical problems, regulatory pressures, or policy changes, could disproportionately impact Ethereum prices globally.
Comparing 2025's pattern to prior cycles reveals the shift. In 2017, Bitcoin's rally was driven by retail FOMO and spot buying. In 2020-2021, institutional spot accumulation and ETF proposals drove Bitcoin and Ethereum higher. In 2025, derivatives speculation increasingly dominates. This evolution mirrors traditional financial markets, where derivatives often exceed underlying asset volumes, but crypto's transition occurred remarkably quickly.
The funding rate mechanism in perpetual markets adds another complexity. When perpetual prices exceed spot, long holders pay funding to shorts. During the 2025 rally, sustained positive funding rates indicated longs dominated, paying billions in aggregate to maintain positions. These costs eventually pressure traders to close, potentially triggering reversals.
Looking forward, Ethereum's trading structure presents both opportunities and risks. On one hand, deep derivatives markets provide sophisticated hedging tools and price efficiency. On the other, excessive leverage creates volatility amplification and crash risk. Whether Ethereum matures into a more balanced market or repeats cycles of leveraged euphoria and liquidation cascades remains to be seen.
Volume as a Market Sentiment Indicator
Technical analysts have long used trading volume to validate price movements and identify potential reversals. In crypto markets, where price action can be violent and seemingly random, volume analysis provides crucial context for understanding market dynamics.
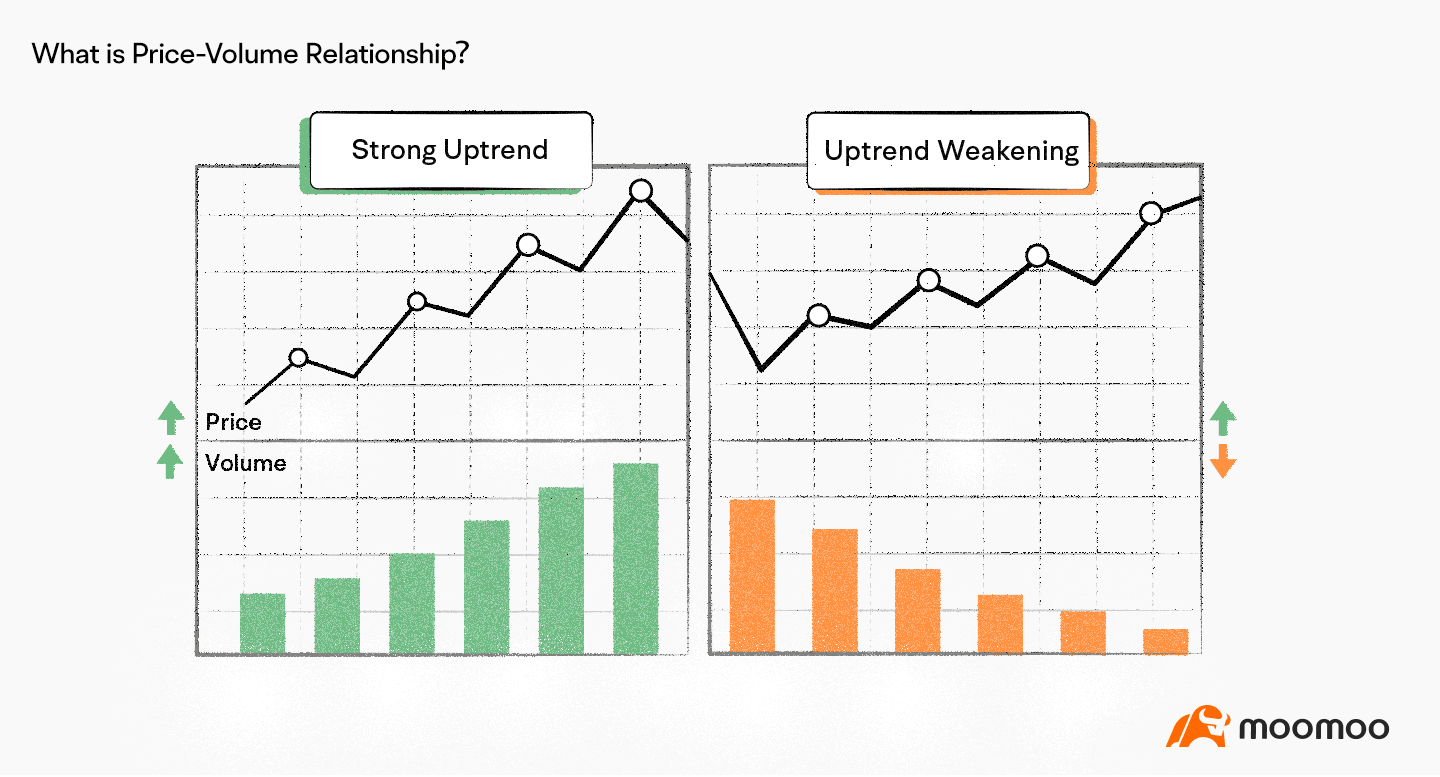
The basic principle holds that volume should confirm trends. During genuine uptrends, rising prices should accompany increasing volume, showing accumulation by new buyers. Declining volume during rallies suggests weakening momentum and potential exhaustion. Conversely, downtrends should see volume increase on selloffs and decrease on bounces, indicating persistent selling pressure.
Volume divergences often precede major reversals. If Bitcoin makes new price highs but volume falls short of levels seen at previous highs, this bearish divergence warns that fewer participants support the rally. Smart money may be distributing while retail chases momentum. Similarly, if prices make lower lows but volume decreases, it signals seller exhaustion and potential bottoming.
Several indicators formalize volume analysis. The Volume-Weighted Average Price (VWAP) calculates the average price weighted by volume throughout a trading session. VWAP serves as a dynamic support/resistance level and benchmark for institutional traders. Prices above VWAP suggest buyers control the session; below indicates seller dominance. Many institutional traders specifically target VWAP execution, either accumulating below it or distributing above it.
VWAP calculation is straightforward: for each period, multiply typical price (average of high, low, and close) by volume, sum these products, then divide by total volume. In crypto's 24/7 markets, VWAP typically resets at UTC midnight, though traders can adjust reset periods based on strategy.
On-Balance Volume (OBV) provides another powerful tool. OBV creates a running tally by adding volume on up days and subtracting it on down days. This cumulative indicator reveals whether volume flows predominantly toward buying or selling over time. OBV divergences from price often signal impending reversals. If Ethereum rallies but OBV declines, it suggests distribution despite rising prices.
Exchange flow ratios track the balance between deposits to and withdrawals from exchanges. Large inflows typically precede selling as investors move coins to exchanges to sell. Conversely, withdrawals to cold storage suggest accumulation and reduced selling pressure. Binance's Bitcoin reserves increased by 22,106 BTC in spring 2025, signaling potential selling pressure as investors moved coins to the exchange.
Volume spikes often precede significant moves in either direction. A sudden volume increase accompanied by a breakout from consolidation tends to be more reliable than low-volume breakouts. However, traders must distinguish between legitimate volume surges and wash trading or liquidation-driven spikes.
The October 2025 crash illustrated volume patterns around liquidation events. As Bitcoin fell from $122,000 to $104,000, volume exploded as over 1.6 million traders were liquidated. This volume surge reflected forced selling rather than organic market dynamics, creating a capitulation event that often marks temporary bottoms.
Context matters critically in volume analysis. During the Asian trading session, Bitcoin volume might surge due to regional investor activity. During U.S. market hours, volume patterns differ. Holidays and weekends typically see reduced volume and increased volatility as thinner liquidity allows larger price swings on smaller orders.
Institutional vs. Retail Volume: Who's Driving the Flow?
The composition of trading volume between institutional and retail participants fundamentally shapes market dynamics. These groups trade differently, respond to different information, and create distinct volume patterns.
Institutional investors typically engage in substantially larger transactions. Individual trades often range in the millions of dollars, while retail trades might be just hundreds or thousands. This size differential means a handful of institutional trades can equal the volume of thousands of retail transactions.
Institutions also access more sophisticated tools and information. They employ quantitative analysts, maintain Bloomberg terminals, and leverage advanced execution algorithms. Over 80% of institutional crypto exposure routes through derivatives rather than spot holdings, reflecting sophisticated hedging strategies beyond retail traders' typical approaches.
Behavioral differences separate these groups as well. Institutional traders deploy capital with longer time horizons, using algorithms and on-chain data for precise timing. Data shows a 20% increase in Bitcoin wallet addresses holding over 1,000 BTC in May 2025, suggesting whale accumulation during market weakness.
Retail traders, conversely, often react emotionally to price movements. FOMO drives retail buying into rallies, while panic accelerates retail selling during drops. A 30% surge in Dogecoin trading volume on Coinbase correlated with social media buzz rather than fundamental developments, typifying retail-driven moves.
These behavioral patterns create identifiable volume signatures. Institutional accumulation often occurs during market weakness when retail panics. Volume may be modest but persistent as institutions steadily build positions over weeks or months. Retail-driven rallies see explosive volume increases as FOMO spreads, often marking local tops as institutions distribute to eager retail buyers.
The 2025 Q1 data from Coinbase showed institutional trading volume declining 36% while retail dropped 58%, demonstrating institutions' resilience during market stress. This pattern repeats across cycles: institutions reduce activity more gradually while retail completely exits during fear.
ETF launches in 2024-2025 dramatically increased institutional access to crypto. Bitcoin ETFs drew $2.2 billion in weekly inflows, while Ethereum ETFs saw record $2.12 billion inflows, providing regulated vehicles for institutional capital. These flows represent long-term capital rather than speculative trading.
Market makers form a third category between institutions and retail. These professional trading firms like Galaxy Digital and Cumberland provide liquidity by continuously quoting both buy and sell prices. Their volume stems from thousands of small trades capturing bid-ask spreads rather than directional bets.
High-frequency trading (HFT) firms execute thousands of trades per second, generating significant volume while holding positions for milliseconds. HFT volume reflects arbitrage and market-making rather than investment views, but still provides liquidity that facilitates price discovery.
The shift toward institutional participation changes market character. Institutional-dominated markets tend toward lower volatility, stronger correlation with traditional assets, and more efficient pricing. However, they also may concentrate risk, as a few large players can significantly impact prices through large orders or coordinated actions.
Risks of Volume-Driven Markets
While high trading volume generally improves market efficiency, derivatives-driven volume concentration creates systemic vulnerabilities that threaten market stability.
The October 2025 liquidation cascade demonstrated these risks vividly. Over $19 billion in leveraged positions evaporated within 24 hours as a geopolitical shock triggered margin calls. This event surpassed previous records, affecting more than 1.6 million traders across multiple platforms.
The mechanics of liquidation cascades follow predictable patterns. Initial price drops trigger automatic liquidations for the most leveraged positions. These forced sales create selling pressure, pushing prices lower and triggering additional liquidations. This feedback loop accelerates dramatically when order books thin, as each liquidation has greater price impact in low-liquidity environments.
High leverage magnifies these effects. With 100x leverage commonly available, a 1% adverse price move liquidates positions. During volatile events, prices can move 10-20% within hours, wiping out leveraged traders at all levels. Midcap and small-cap tokens fell 60-80% during the October cascade, far exceeding Bitcoin's 11% decline.
Exchange infrastructure struggles during extreme stress. Traditional markets employ circuit breakers that halt trading during rapid moves, allowing participants to assess situations. Crypto markets lack these protections, operating continuously even during cascades. This 24/7 structure, combined with fragmented global liquidity, prevents the coordinated interventions possible in traditional finance.
The risk extends beyond individual traders to exchange solvency. When liquidations occur faster than exchanges can process, losses may exceed traders' margin. Exchanges maintain insurance funds exceeding $670 million to cover such shortfalls, but sufficiently large events could exhaust these reserves, potentially threatening platform stability.
Flash crashes represent another volume-driven risk. Thin order books combined with large market orders can cause temporary price collapses of 10-20% that reverse within minutes. These crashes punish stop-loss orders and trigger liquidations despite prices quickly recovering. Binance offered $300 million in compensation after reportedly liquidating positions automatically despite traders having sufficient margin.
Manipulation becomes easier in volume-driven markets where derivatives dominate. Traders with sufficient capital can trigger liquidation cascades intentionally, profiting from the resulting volatility. Moving spot prices strategically to trigger derivative liquidations enables sophisticated manipulation difficult to detect or prevent.
Proof of reserves and exchange transparency help mitigate these risks. Exchanges publishing cryptographic proofs of their holdings enable users to verify platforms maintain assets matching liabilities. However, many exchanges resist transparency, claiming competitive concerns.
The concentration of open interest creates additional systemic risk. With Binance holding 24.61% of total open interest, problems at this single platform could trigger market-wide disruption. This concentration contradicts crypto's decentralization ethos and reintroduces single points of failure.
Regulatory attention to these risks is growing. The massive October liquidations affecting over 1.6 million traders globally will likely prompt coordinated regulatory responses. Potential measures include leverage limits, mandatory disclosures, circuit breakers, or central clearing requirements for derivatives.
Final thoughts
Trading volume serves as crypto markets' vital sign, revealing activity levels, liquidity depth, and participant engagement. However, the meaning of volume has evolved dramatically as derivatives have come to dominate market structure.
Ethereum's $6 trillion in Binance trading volume for 2025 tells a story not of organic growth but of speculative fervor. The fivefold increase in open interest to $12.5 billion signals that leverage, not conviction, drives this activity. When CryptoQuant analysts note that speculation now plays a much larger role than in previous cycles, they're identifying a fundamental shift in market character.
This shift carries both opportunities and risks. Derivatives enable sophisticated hedging, provide price discovery mechanisms, and allow market participation without holding actual assets. These tools have legitimized crypto by providing institutional-grade products comparable to traditional finance.
Yet derivatives-driven markets exhibit fragility absent from spot-dominated ones. The October 2025 liquidations wiping out $19 billion demonstrated how quickly leveraged markets unravel when shocks occur. The 1.6 million traders liquidated in 24 hours show that speculation at scale creates systemic vulnerability.
Sustainable market growth requires balance. Perpetual contracts accounting for 78% of derivatives volume and derivatives representing 79% of total crypto activity suggests imbalance. Healthy markets need spot accumulation, patient capital, and reduced leverage alongside derivative sophistication.
True market maturity will show in different metrics than headline volume. Increasing ratios of long-term holders, growing on-chain activity, expanding real-world use cases, and declining leverage ratios would signal genuine adoption rather than speculative rotation.
The question facing Ethereum and broader crypto markets is whether 2025's patterns represent temporary excess or permanent transformation. Will markets self-correct toward more balanced spot-derivatives ratios? Will regulation impose leverage limits and transparency requirements? Or will crypto remain a high-octane, derivatives-driven casino?
The answer matters for crypto's long-term viability. Technology and infrastructure continue improving. Regulatory clarity slowly emerges. Institutional participation expands. These positive developments risk being overshadowed by leverage-induced volatility and speculation-driven crashes that erode trust and invite crackdowns.
For traders and investors, the lesson is clear: volume numbers alone reveal little. Understanding volume sources, distinguishing derivatives from spot, recognizing wash trading, and monitoring leverage metrics provides the context necessary for informed decisions.
Markets work best when volume reflects genuine supply and demand rather than leveraged bets on short-term moves. Whether crypto achieves this balance or continues its current trajectory will determine if digital assets mature into legitimate alternative financial infrastructure or remain perpetual speculative instruments.
The $6 trillion in Ethereum trading volume on Binance is not a success story to celebrate but a warning signal requiring attention. It reveals a market structure optimized for speculation rather than sustainable growth, driven by leverage rather than conviction, and prone to cascades rather than stable appreciation.
Only by recognizing these patterns and demanding better, through participant behavior and regulatory oversight, can crypto markets evolve beyond volume-for-volume's-sake toward the genuine price discovery and capital formation that legitimate financial markets require.