





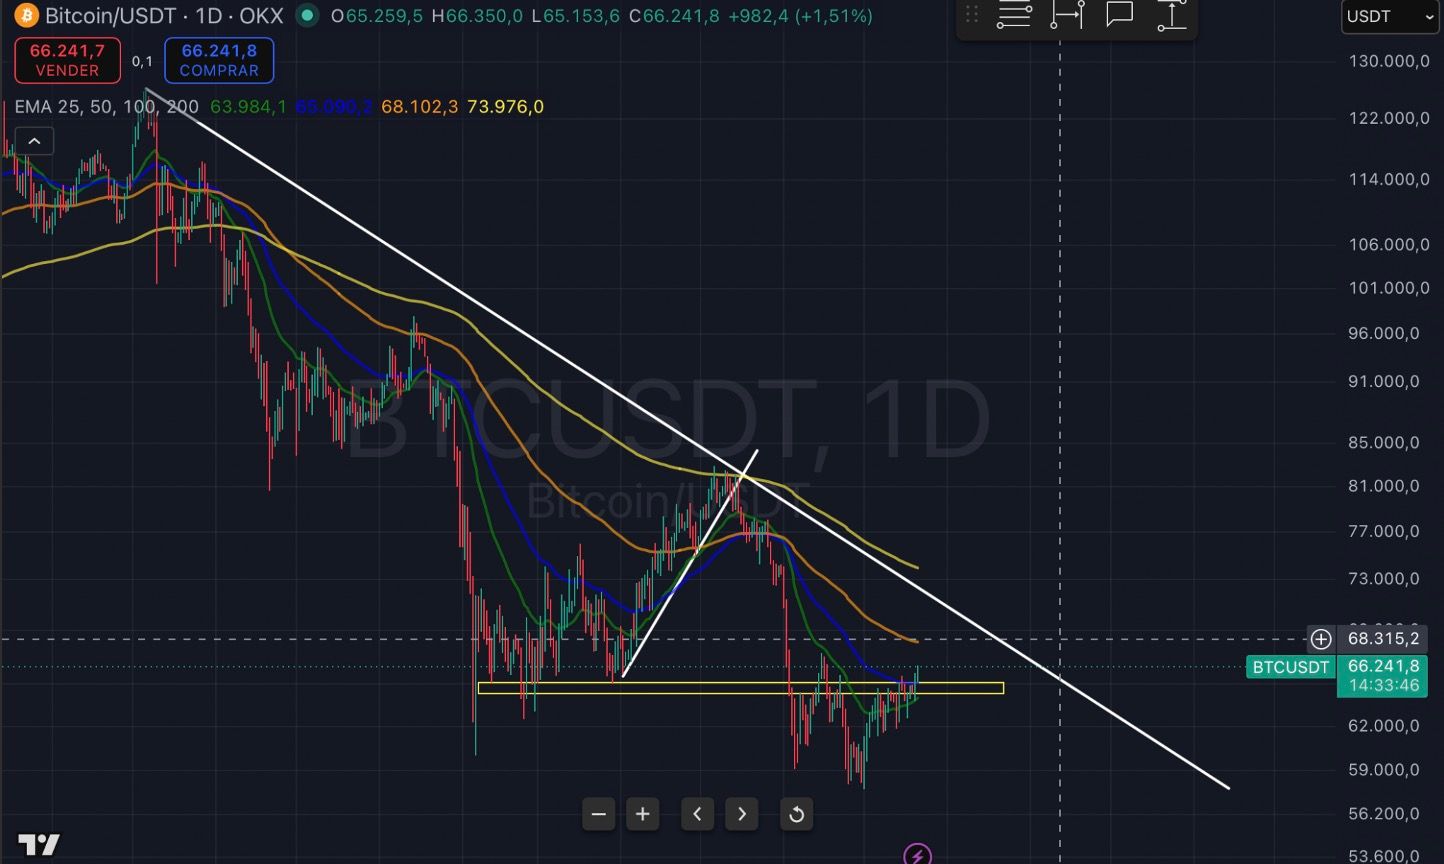
Breaking Above Resistance
As I mentioned in last week's market analysis, if Bitcoin managed to close above our daily resistance zone, the next target would be the $68,000-$70,000 area.
That is exactly what we are seeing now. Price is trading above that resistance with renewed buying pressure. It is a positive first signal, but it is still too early to call it a full trend reversal.
For now, my view remains the same: as long as Bitcoin holds above this zone, a move toward $68,000-$70,000 remains possible. However, if price quickly falls back below the breakout level, we should stay cautious, as it could simply turn into a false breakout.
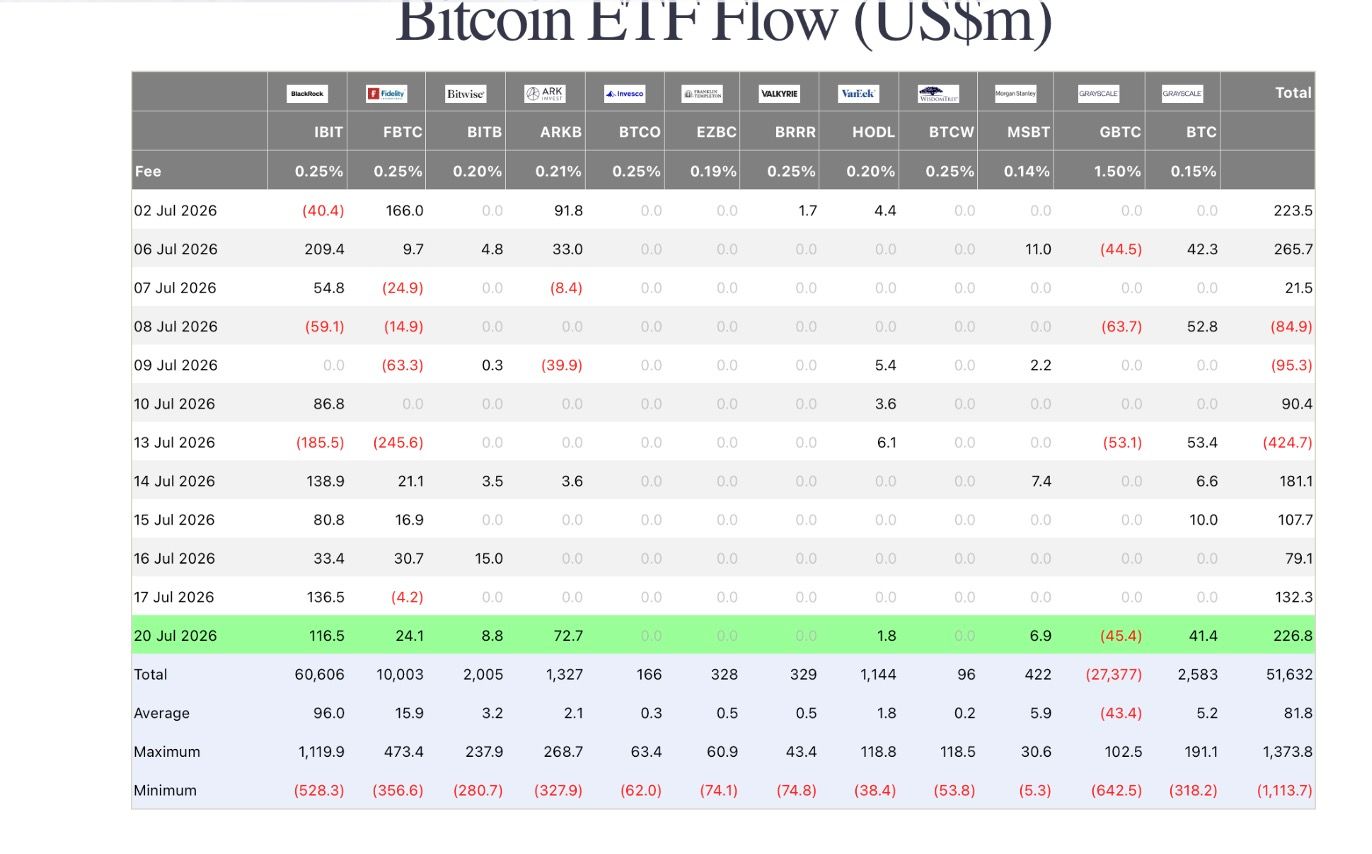
Bitcoin ETF Flows
Looking at the Bitcoin ETF flows, we can see several consecutive days of net inflows. This is a positive sign, but the amounts remain relatively small compared to the strong institutional buying we have seen during previous accumulation phases.
At this stage, I see these inflows as an early sign of renewed interest rather than clear evidence that large institutional players are aggressively accumulating again. To confirm a real shift in sentiment, we need to see much larger and more consistent inflows over the coming sessions.
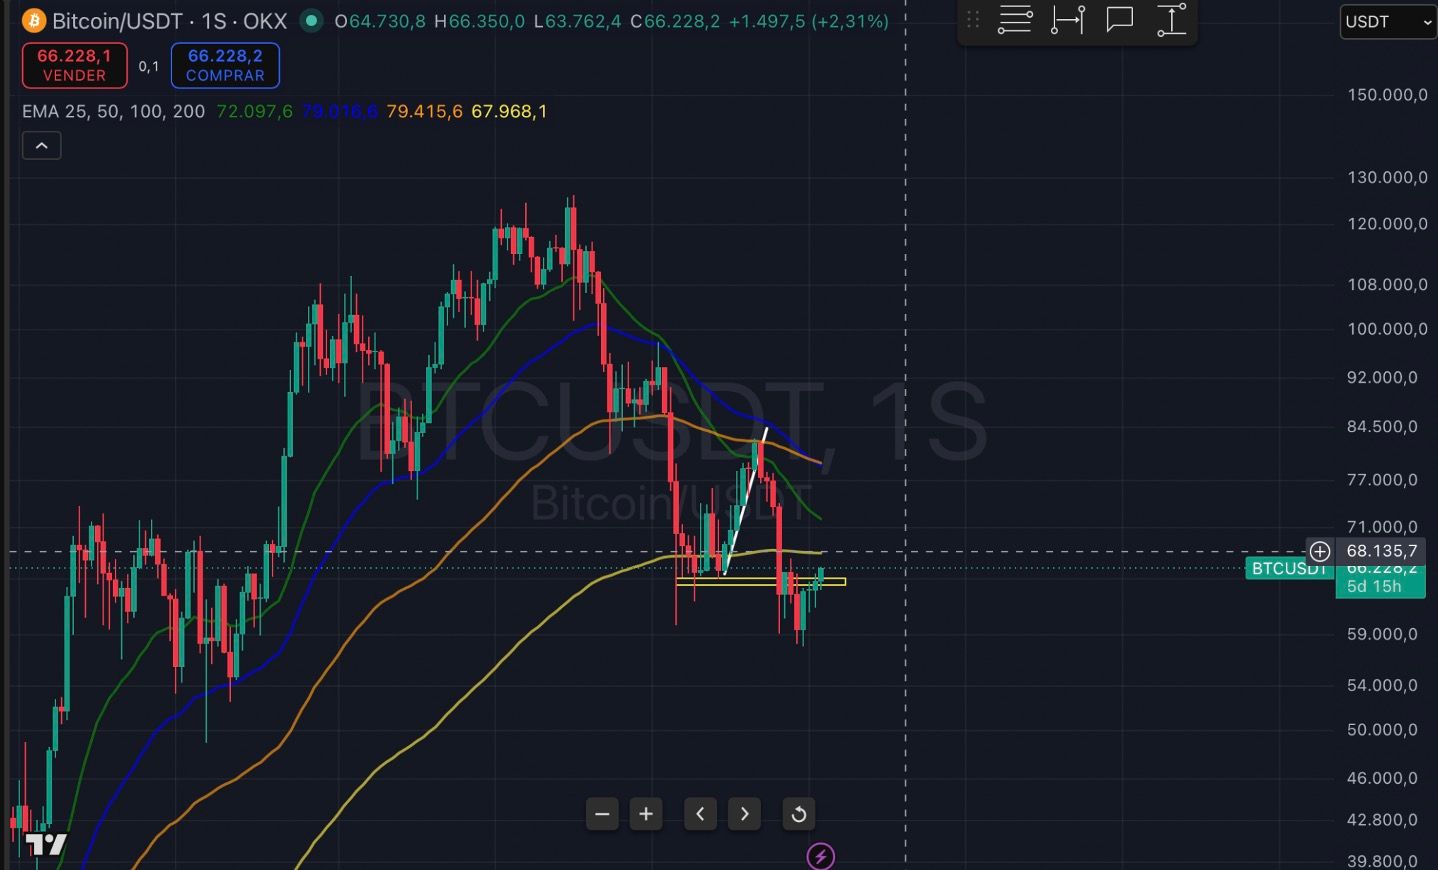
The Weekly 200 EMA
Looking at the weekly chart, one level stands out: Bitcoin is gradually approaching the 200 EMA, a moving average that has historically played a major role during long-term trend changes.
If Bitcoin manages to close above this level, the bullish scenario could extend well beyond my initial $68,000-$70,000 target. It would be a strong sign that buyers are starting to regain control of the market.
However, until that happens, I remain cautious. From a macro perspective, my outlook is still bearish. A rejection at the weekly 200 EMA could quickly send Bitcoin back toward the lower price levels seen over the past few weeks.