


President Trump's 100% tariff announcement triggered the largest liquidation event in crypto history - and it wasn't even close.
It took just eight hours.
That's how long it took for $19 billion in leveraged crypto positions to evaporate after President Donald Trump announced a 100% tariff on Chinese imports on Friday evening, October 10, 2025. By the time Asian markets opened Saturday morning, over 1.6 million trader accounts had been liquidated in what data tracker Coinglass officially designated as "the largest liquidation event in cryptocurrency history."
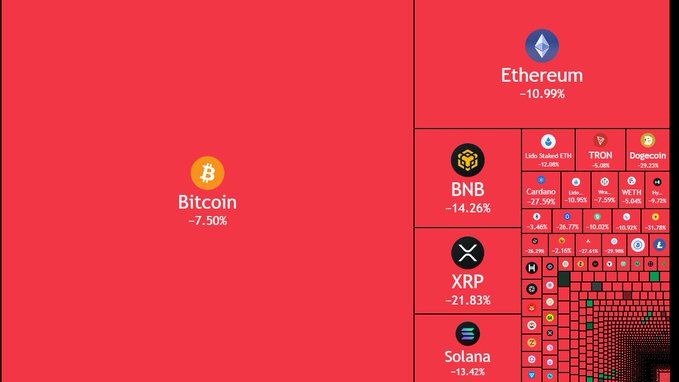
Bitcoin crashed from $122,000 to below $107,000 - a gut-wrenching 12% freefall. Ethereum plunged 16%. Altcoins? Forget about it. Some tokens hemorrhaged 40% of their value in a matter of hours.
The carnage dwarfed every previous crypto crash - by a lot. The May 2021 sell-off that everyone thought was bad? That was $10 billion. The COVID crash in March 2020? A mere $1.2 billion. FTX's spectacular implosion? $1.6 billion. October 10-11, 2025 was 10 to 20 times larger than any liquidation event in crypto's 16-year history.
Yet here's what makes this crash fascinating: the crypto market's infrastructure mostly held together. Stablecoins maintained their dollar pegs. Major exchanges processed billions in forced sales without collapsing. DeFi protocols liquidated hundreds of millions in bad loans without accumulating toxic debt. And remarkably, as of Saturday afternoon, not a single U.S. regulatory agency - not the SEC, CFTC, or Treasury - had issued any statement about an event that wiped out more capital in hours than some countries' annual GDP.
So what the hell happened? Let's break down the wildest 48 hours in crypto this year.
The Spark: China Plays the Rare Earth Card

The fuse was lit in Beijing on Wednesday, October 9. China's Ministry of Commerce announced sweeping export controls on rare earth elements - those obscure but critical materials needed for semiconductors, electric vehicles, defense systems, and basically every piece of modern technology you own.
Here's the thing about rare earths: China controls 70% of global supply and 90% of processing capacity. When Beijing says foreign companies need licenses to export products containing more than 0.1% rare earth content, that's economic leverage at its most potent.
The announcement landed like a bombshell on global markets. These aren't just some random minerals - they're the foundation of modern technology supply chains. Neodymium for electric vehicle motors. Dysprosium for wind turbines. Europium for LED screens. Terbium for semiconductors. Without rare earths, the entire global tech industry grinds to a halt.
China had been gradually tightening control over rare earth exports for months, but this was different. This was a declaration of economic warfare. And Trump wasn't about to let that slide.
Friday Morning: Trump Fires the First Shot
At 11:26 AM EDT on Friday, Trump posted on Truth Social threatening a "massive increase" in tariffs on Chinese products and dangled the possibility of canceling his scheduled meeting with President Xi Jinping at the upcoming APEC summit in South Korea.
"I was to meet President Xi in two weeks, at APEC, in South Korea, but now there seems to be no reason to do so," Trump wrote. "There is no way that China should be allowed to hold the World 'captive.'"
The post immediately sent shockwaves through financial markets. This wasn't just another Trump trade threat - this was escalation at a critical moment when the global economy was already showing signs of fragility.
The market's initial reaction was swift but measured:
- Bitcoin dipped from $122,000 to around $117,000-$118,000
- Ethereum fell about 4.7% to $4,104
- The first liquidation wave hit about $770 million
But the real damage was happening in traditional markets. The S&P 500 fell 1.2% from session highs within minutes of Trump's post. The Nasdaq dropped 1.7%. Tech stocks - many with supply chains deeply integrated with China - got absolutely hammered.
By the closing bell at 4:00 PM EDT, traditional equity markets had taken a serious beating:
- S&P 500: -2.71% (worst day since April 2025)
- Nasdaq Composite: -3.56%
- Dow Jones Industrial Average: -876 points (-1.9%)
The S&P 500 had erased $1.2 trillion in market capitalization in just 40 minutes after Trump's morning post. Semiconductor stocks were down 5-7%. Apple, with its massive China exposure, dropped 4.2%. Tesla fell 6.8%.
But that was just the appetizer. With traditional markets safely closed for the weekend, Trump was about to drop a bomb that would make the morning's losses look like a rounding error.
5:08 PM EDT: The Bomb Drops
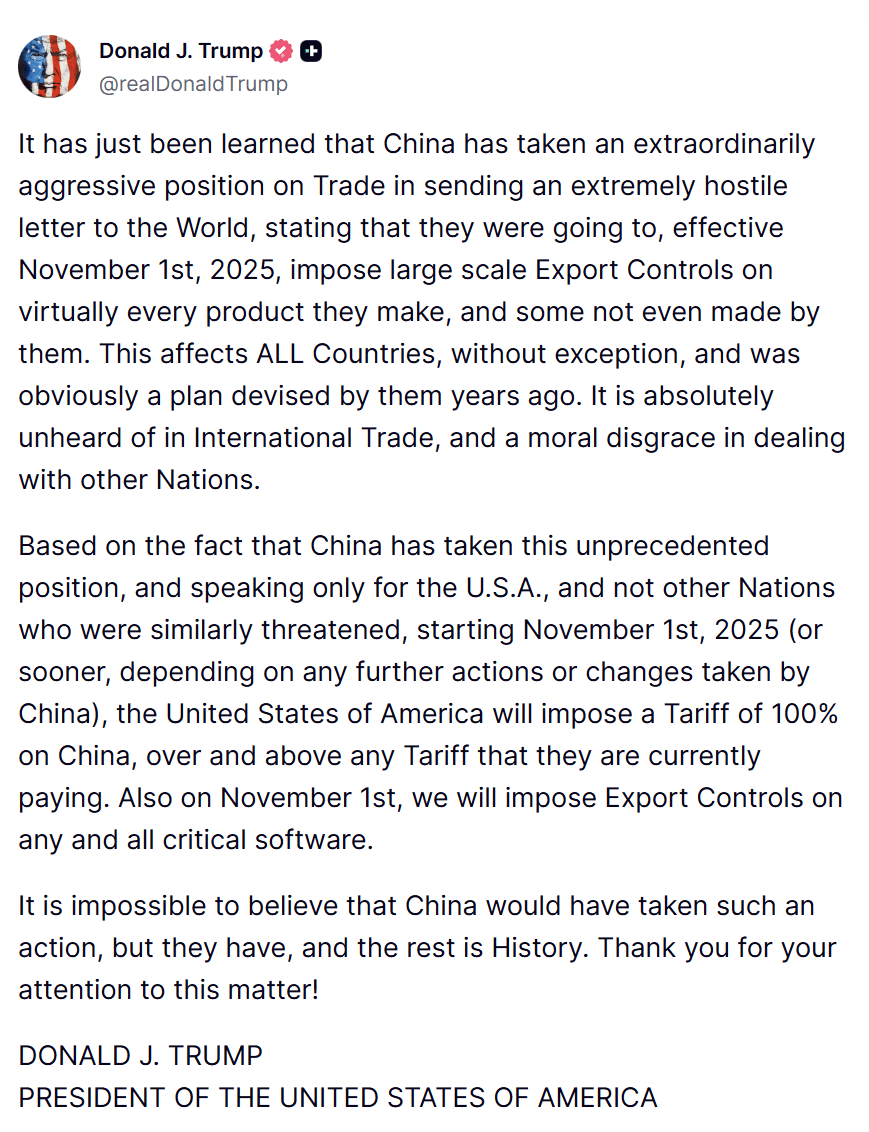
At approximately 5:08 PM EDT - just over an hour after the closing bell - Trump posted the specifics on Truth Social. And they were absolutely brutal.
A 100% additional tariff on all Chinese imports - on top of the 30% tariff China already faced (20% for fentanyl-related measures plus 10% reciprocal tariffs). That meant a total tariff rate of 130%, effective November 1, 2025 "or sooner, depending on any further actions or changes taken by China."
But wait, there was more. Trump also announced export controls on "any and all critical software" from U.S. firms to China. This wasn't just about trade - this was about technology decoupling on a scale never seen before.
Trump's post characterized China's rare earth controls as "an extremely hostile letter to the World" and "a moral disgrace in dealing with other Nations." The language was unusually aggressive, even for Trump.
Within seconds, crypto markets started convulsing. Bitcoin immediately dropped $3,000. Then the selling accelerated. Then it became a stampede.
Crypto traders watching their screens couldn't believe what they were seeing. Order books were getting torn through like tissue paper. Prices were updating multiple times per second - and every update was lower.
This was the moment everything broke.
The Liquidation Cascade: How $19 Billion Vanished
What happened over the next three hours can only be described as a massacre.
Within 90 minutes of Trump's specific tariff announcement, the crypto market turned into an absolute bloodbath. Every major cryptocurrency was in freefall. Leveraged positions were getting liquidated by the thousands. Margin calls were flooding exchange systems. And the forced selling was creating a feedback loop that kept driving prices lower and lower.
Bitcoin's Brutal Descent
Bitcoin crashed below $110,000 within the first hour, with some exchanges seeing it flash-crash as low as $105,262. On Binance, the world's largest crypto exchange, BTC briefly touched $106,100 before bouncing slightly. On Coinbase, it hit $107,300. The spreads between exchanges - normally just a few hundred dollars - widened to over $2,000 as liquidity evaporated.
From the daily high of $122,456 to the intraday low of $105,262, Bitcoin had fallen 13.6%. More than $250 billion in Bitcoin market capitalization had vanished in hours.
For context, that's more than the entire market cap of Netflix, Coca-Cola, or Pfizer. Gone. In an evening.
Ethereum's Collapse
Ethereum, which had been trading around $4,300-$4,400 earlier in the day, plunged to lows between $3,461 and $3,761 depending on the exchange. The 16-18% decline was even steeper than Bitcoin's - and for good reason.
As the foundation of DeFi (decentralized finance), Ethereum wasn't just dealing with spot market panic. It was also facing a wave of automated liquidations from lending protocols, forced selling from DeFi treasuries trying to maintain their operations, and a spike in network congestion that sent gas fees soaring to 150+ gwei - the highest levels seen in months.
When gas fees spike during a crash, it creates a vicious cycle: high fees make it more expensive to close positions or move assets to safety, which creates more panic, which creates more transactions, which drives fees even higher. It's a nightmare scenario for anyone trying to preserve capital.
The Altcoin Apocalypse
But if Bitcoin and Ethereum were having a bad night, altcoins were experiencing an extinction-level event.
XRP, which had been riding high at $3.10, crashed as low as $2.40-$2.42 - a decline of 20-30% depending on timing. Solana plummeted from $240 to lows between $150-$182, a devastating 25-30% drop. Dogecoin fell 22-30% from $0.25 to $0.19.
And those were the blue chips. Smaller altcoins were getting absolutely annihilated:
- Cardano (ADA) dropped 40% from $0.85 to $0.51
- Chainlink (LINK) fell 40% from $22-23 to $17-18
- Aave (AAVE) plunged 40% from $290-300 to $232
The total crypto market capitalization plummeted from $4.27 trillion to $4.05 trillion - $220 billion evaporated in less than four hours. To put that in perspective, that's roughly equal to the GDP of New Zealand or Portugal. Just gone.
Peak Liquidation: 9:00 PM - 11:00 PM EDT
Between 9:00 PM and 11:00 PM EDT, the liquidation tsunami reached its absolute peak. This was the eye of the storm, when the forced selling reached a fever pitch that would go down in crypto history.
Data from Coinglass showed more than $6 billion in liquidations flooding exchange matching engines during this two-hour window alone. That's $50 million per minute. $833,000 per second. Absolutely unprecedented.
The mechanics of what was happening were brutal in their efficiency:
Traders who had taken leveraged long positions - betting that prices would go up - were getting margin calls as Bitcoin fell. When they couldn't deposit more collateral fast enough, exchanges' automated liquidation engines kicked in, forcibly selling their positions at market prices.
But here's where it gets worse: those forced market sells added more downward pressure on prices. Which triggered the next tier of margin calls. Which caused more liquidations. Which pushed prices lower. Which triggered even more margin calls.
It was a liquidation cascade - a self-reinforcing feedback loop where each wave of forced selling created the conditions for the next wave. And with so many traders using similar leverage levels and similar stop-loss points, the cascade became explosive.
Market makers - the firms that normally provide liquidity by offering to buy and sell at quoted prices - pulled back to manage their own risk exposure. Why would they catch a falling knife when they had no idea where the bottom was? Order book depth evaporated. On some smaller altcoins, the order books were so thin that single market sells of $100,000 would move the price 5-10%.
Spreads widened dramatically. On major pairs like BTC/USDT, spreads that are normally $10-20 blew out to $500-1,000. On altcoins, spreads widened by 500% or more. If you wanted to sell, you were going to pay a massive premium in slippage.
The total 24-hour liquidation figure eventually reached $19.13 billion - though Coinglass noted that the "actual total is likely much higher" since Binance, the world's largest exchange, reported data slowly during the crisis.
The Long/Short Massacre: 87% Were Bulls
Here's the stat that tells you everything you need to know about how one-sided the market positioning had become: of the $19.13 billion liquidated, $16.6 billion were long positions. That's 87% of the total.
Only $2.4 billion in shorts got squeezed - just 13% of liquidations.
Think about what that means. For every seven traders betting on prices going up, only one was betting on prices going down. The market had become massively, dangerously overweight bullish positions. And when Trump dropped his tariff bomb, all those bulls got slaughtered at once.
This wasn't a balanced market experiencing normal volatility. This was a crowded trade exploding in spectacular fashion.
The data shows that nearly 1.6 million trader accounts were liquidated - representing positions ranging from a few hundred dollars to the massive $87.5 million BTC/USDT long position on HTX exchange that became the largest single centralized exchange liquidation in history.
On Hyperliquid, a decentralized perpetuals platform, traders watched in real-time as a $203 million ETH/USDT long position got liquidated - the largest DEX liquidation ever recorded. Multiple other positions in the $15-20 million range were also wiped out on the platform.
Some estimates suggest that as many as 96% of futures traders were liquidated during the worst hours of the cascade. That's not a market correction. That's a liquidation apocalypse.
Why Tariffs Crush Crypto: The Macro Transmission
If you're wondering why a trade announcement about Chinese electronics would tank Bitcoin, you're asking the right question. The answer reveals how much crypto has changed over the past few years.
Crypto isn't the Wild West anymore. It's become an institutional asset class. Major pension funds hold Bitcoin. Hedge funds trade Ethereum. Family offices allocate to crypto as part of diversified portfolios. BlackRock's Bitcoin ETF holds nearly $100 billion in assets.
And institutions don't think of crypto as some revolutionary parallel financial system. They think of it as a high-beta tech proxy - a leveraged bet on innovation, risk appetite, and economic growth.
When Trump announces 130% tariffs that could trigger a recession, institutional algorithms don't discriminate. Everything risky gets sold simultaneously. Nasdaq stocks, Bitcoin, Ethereum, high-yield bonds, emerging market currencies - it all goes down together.
Thomas Perfumo, Kraken's global economist, explained it perfectly: "The decline in crypto markets reflects a broader risk-off sentiment. This isn't an exodus from crypto, but a macro-driven recalibration."
Let's break down the transmission mechanisms - how tariff news translates into crypto selling:
1. Supply Chain Disruption
A 130% tariff combined with export controls on critical software threatens global technology supply chains. That's not just bad for Apple and Tesla - it's bad for the entire crypto infrastructure.
Bitcoin mining hardware? Mostly manufactured in China or using Chinese components. ASICs, the specialized chips that mine Bitcoin, rely on advanced semiconductor manufacturing. Export controls on critical software could disrupt the tools needed to design and manufacture these chips.
Ethereum nodes? Running on servers built with global supply chains deeply integrated with Chinese manufacturing.
The physical infrastructure of crypto - the miners, the nodes, the data centers - all depend on the global technology supply chain. When that supply chain faces existential threats, crypto infrastructure faces risks.
2. Inflation Fears and Fed Policy
Basic economics: when you slap 130% tariffs on imports from your largest trading partner, those costs get passed to consumers. Prices rise. Inflation accelerates.
The Federal Reserve's job is to control inflation. When inflation rises, the Fed raises interest rates or keeps them elevated longer than markets expect. Higher interest rates make risk-free Treasury bonds more attractive relative to risky assets like crypto.
It's the classic "risk-free rate" problem: why would you hold volatile Bitcoin if you can get 5% risk-free in T-bills? As rates rise, capital flows from risky assets toward safe assets. Crypto, as one of the riskiest asset classes, gets hit first and hardest.
Markets had been pricing in Fed rate cuts for late 2025 and early 2026. Trump's tariff announcement threw those expectations out the window. If tariffs drive inflation higher, the Fed stays hawkish longer. That's bad for risk assets.
3. Recession Risks
Trade wars reduce global GDP growth. When you make trade more expensive, you get less trade. Less trade means less economic activity. Less economic activity means recession risk.
Economists immediately started warning about recession probabilities after Trump's announcement. JPMorgan raised its recession probability from 30% to 45%. Goldman Sachs published a note warning that 130% tariffs could shave 1.5% off U.S. GDP growth in 2026.
Recessions crush risk assets. During the 2008 financial crisis, Bitcoin didn't exist yet - but in the March 2020 COVID recession, Bitcoin fell 50% in two days. During recessions, investors flee to safety. They want cash, gold, and Treasury bonds - not speculative digital assets.
4. Dollar Strength
When global risk rises, money flows into U.S. dollars as a safe haven. The dollar strengthens. But Bitcoin and most cryptocurrencies are priced in dollars.
When the dollar strengthens, crypto becomes more expensive for international buyers. A Chinese buyer needs more yuan to buy the same amount of Bitcoin. A European buyer needs more euros. Demand from non-U.S. buyers falls.
During the October 10-11 crash, the U.S. Dollar Index (DXY) rose 0.8% - confirming safe-haven flows into dollars and away from risk assets.
5. Correlation With Tech Stocks
Perhaps most importantly, Bitcoin's correlation with tech stocks (especially the Nasdaq) has increased dramatically since institutional adoption began. When Nasdaq falls, Bitcoin falls. When tech stocks rally, Bitcoin rallies.
On October 10, the Nasdaq fell 3.56%. Bitcoin fell 12%. That's about 3.4x the leverage - exactly what you'd expect from a "high-beta tech proxy."
And here's the kicker: while crypto crashed, gold rose 1.7% during the same period. That confirms this was genuine risk-off behavior, not just random market chaos. Safe havens rallied. Risk assets collapsed. Textbook stuff.
The Leverage Time Bomb Explodes
Here's what made this crash so utterly devastating: the crypto market was absurdly over-leveraged going into Friday.
The warning signs had been flashing for days, but everyone ignored them because prices kept going up. Bitcoin had just hit an all-time high of $126,223 on October 6-7. Ethereum was within striking distance of $5,000. Altcoins were rallying across the board. Everyone was making money. Why would you reduce leverage when you're winning?
This is called "recency bias" and it destroys more traders than any other cognitive error. Just because prices went up yesterday doesn't mean they'll go up tomorrow.
The data was screaming danger: Funding Rates Above 8%
In perpetual futures contracts, funding rates measure the cost of holding a position. When funding rates are positive, longs pay shorts a periodic fee. When they're negative, shorts pay longs.
Normal funding rates on Bitcoin perpetuals are around 0.01-0.03% (about 10-30% annualized). In the days before the crash, funding rates had exploded above 8% on some exchanges - implying an annualized cost of over 700% to hold long positions.
That's insane. Funding rates above 8% means the market is so crowded into longs that shorts can demand massive premiums just to take the other side of trades. It's a classic warning sign of extreme positioning and imminent mean reversion.
$100 Billion in Bitcoin Open Interest
Open interest - the total value of outstanding derivatives positions - had been climbing steadily through early October. Bitcoin open interest alone was approaching $100 billion across all exchanges. Total crypto derivatives open interest had reached $187 billion.
For context, during the May 2021 crash that liquidated $10 billion, total open interest was around $60 billion. The system was holding 3x more leveraged exposure than during one of the biggest crashes in crypto history.
100-200x Leverage Still Available
Despite all the lessons supposedly learned from previous liquidation cascades, major exchanges were still offering truly absurd leverage ratios. MEXC offered 200x on Bitcoin futures. Bybit offered 100x. Binance offered up to 125x.
When you're trading with 100x leverage, a 1% move against you wipes out your entire account. A 12% drop in Bitcoin - like what happened on October 10 - doesn't just wipe you out. It vaporizes you and leaves nothing but a liquidation notice.
Think about the math: if you're long Bitcoin with 100x leverage at $120,000, and Bitcoin falls to $118,800 (just a 1% drop), your position is automatically liquidated. You lose everything. With 200x leverage, you're liquidated on a 0.5% move.
This isn't trading. It's gambling. And on October 10, the casino cleaned house.
The Cascade Mechanics
The way the liquidation cascade unfolded was textbook - brutal in its efficiency and beautiful in a dark, destructive way.
Stage 1: The Initial Shock (5:08 PM - 6:00 PM EDT)
Trump's announcement drops Bitcoin 4% from $117,000 to $112,000. Traders using 25x leverage or higher start getting margin calls. Many can't or won't deposit more collateral fast enough.
Stage 2: First Wave Liquidations (6:00 PM - 7:00 PM EDT)
Exchanges' automated liquidation engines activate. The highest-leveraged positions get forcibly closed at market prices. These forced market sells add about $2 billion in selling pressure, driving Bitcoin down another 3% to $109,000.
Stage 3: The Cascade Accelerates (7:00 PM - 9:00 PM EDT)
Lower prices trigger the next tier of margin calls - traders using 15-20x leverage who were fine an hour ago are now underwater. More liquidations. More forced selling. Bitcoin breaks $110,000 support and crashes toward $105,000.
Market makers start pulling back. They can see the cascade forming and they don't want to provide liquidity into a falling knife. Order book depth collapses from normal levels of $50-100 million within 1% of mid-market to barely $10-20 million.
Stage 4: Peak Liquidation (9:00 PM - 11:00 PM EDT)
This is when it gets truly ugly. Cross-margin positions start getting liquidated - when traders use one account to margin multiple positions, a loss in Bitcoin can force liquidation of their Ethereum, Solana, and altcoin holdings too.
Suddenly it's not just Bitcoin falling. Everything is falling simultaneously because automated systems are liquidating entire portfolios to cover Bitcoin losses. The contagion spreads across the entire crypto ecosystem.
Weekend timing makes it worse. Normally, institutional buying through Bitcoin ETFs would provide some support - but ETF markets are closed. There's no cavalry coming. It's just liquidations feeding on liquidations.
Stage 5: Retail Capitulation (11:00 PM - 2:00 AM EDT)
Retail investors who held through the initial crash start panic selling. Maybe they weren't using leverage, but watching their portfolio drop 15% in hours is psychologically brutal. Fear & Greed Index plunges from 70 (Greed) to 35 (Fear) in under 48 hours - one of the fastest sentiment shifts in crypto history.
Stop-losses that retail traders set at "safe" levels like $110,000 or $108,000 get triggered en masse. Every triggered stop-loss is another market sell order that drives prices lower.
Social media amplifies the panic. Twitter is full of liquidation screenshots. Reddit is on fire with loss porn. Crypto influencers are posting threadstorms about how "this could be the top." Fear is contagious.
Stage 6: Asia Opens to Carnage (2:00 AM - 8:00 AM EDT / Saturday Morning in Asia)
Asian traders wake up Saturday morning to absolute chaos. Bitcoin is down 12%. Altcoins are down 20-40%. Everyone is asking: what the hell happened?
Thin weekend liquidity in Asia means even small selling pressure moves prices significantly. Bitcoin trades in a volatile $107,000-$112,000 range with wild 5-minute swings of $2,000-3,000.
By midday Hong Kong time, the liquidation counter crosses $16 billion according to Coinglass. By Saturday afternoon, it reaches the final tally: $19.13 billion.
The Tokens That Bled Hardest: A Coin-by-Coin Autopsy
Not all cryptocurrencies suffered equally during the crash. Market structure, liquidity depth, derivatives exposure, and fundamental use cases all played roles in determining which tokens got hit hardest. Let's break down the biggest casualties.
Cardano (ADA): -40%
The numbers: ADA crashed from $0.85 to as low as $0.51 on some exchanges - a catastrophic 40% decline. Market cap fell from around $28-29 billion to approximately $20 billion. Trading volume exploded over 200% as panic selling accelerated.
Why it got destroyed: Cardano was attempting to break out of a 300-day descending channel pattern right when the crash hit. Technical traders love these setups - when a coin finally breaks out of a long-term downtrend, it often triggers explosive moves higher.
Except this time, leveraged breakout traders got absolutely wrecked. Many had placed stops just below the breakout level around $0.70. When Bitcoin crashed and dragged the entire market down, ADA didn't just fail to break out - it collapsed back into the channel and blew straight through support levels.
The combination of failed technical breakout, high leverage concentration, and Cardano's enormous circulating supply (35.8 billion ADA) meant that even moderate selling pressure translated into huge dollar losses.
Chainlink (LINK): -40%
The numbers: LINK crashed from $22-23 to lows of $17-18. Market cap fell from around $15 billion to approximately $11 billion. Volume surged over 200%.
Why it imploded: Chainlink is the dominant oracle provider for DeFi protocols - it provides the price feeds that tell smart contracts what everything is worth. When the entire DeFi ecosystem was experiencing massive liquidations on platforms like Aave, Compound, and GMX, LINK got dragged down by association.
But there's more to it than that. LINK had extremely heavy derivative positioning going into the crash. Data from exchanges showed LINK perpetual futures open interest had reached multi-month highs, with funding rates indicating most of that positioning was long.
When DeFi lending protocols liquidated billions in collateral and LINK's spot price started falling, those leveraged long positions got liquidated too. It became a feedback loop: DeFi stress → LINK falls → LINK derivatives liquidated → more selling pressure → LINK falls more.
As the infrastructure token for DeFi oracles, LINK's health is tied to DeFi's health. When DeFi is stressed, LINK bleeds.
Aave (AAVE): -40%
The numbers: AAVE plunged from $290-300 to $232. Market cap dropped from around $4.4 billion to approximately $3.2 billion. Volume increased over 250%.
Why it crashed: Aave is the largest DeFi lending protocol, with over $68 billion in total value locked. During the crash, the protocol itself was processing massive liquidations of borrower positions - over $210 million in a comparable stress period.
When users see that Aave is liquidating hundreds of millions in loans, they start wondering: is the protocol itself at risk? Are there bad debts accumulating? Should I sell my AAVE tokens before things get worse?
On-chain data told the story: exchange inflows of AAVE increased 180% during the crash. That's direct evidence of holders moving tokens from wallets to exchanges to sell. Large holders were dumping.
The psychology makes sense. AAVE the token derives value from AAVE the protocol. If the protocol faces existential stress, the token's value is threatened. Even though Aave's liquidation systems actually worked perfectly (zero bad debt accumulated), the perception of risk was enough to trigger panic selling.
Dogecoin (DOGE): -22% to -30%
The numbers: DOGE fell from $0.25 to lows of $0.19. Market cap dropped from $35-40 billion to around $27-30 billion. Volume surged 150%.
Why it bled: Meme coins are pure sentiment. They have no fundamental utility, no protocol revenue, no cash flows - their value exists entirely in the collective belief that someone else will pay more for them tomorrow than you paid today.
During macro stress events, sentiment-driven assets get destroyed. Why would anyone hold Dogecoin when Bitcoin itself is falling 12%? If the king is bleeding, the jesters are dying.
Retail traders were heavily leveraged in DOGE positions, chasing the momentum that had driven the token higher through September and early October. When margin calls hit, those positions got liquidated en masse.
The high nominal trading volume and market cap disguise a critical weakness: thin order books at key price levels. A few million dollars of selling can move DOGE's price by 5-10% because market makers aren't willing to commit significant capital to make markets in a meme coin during volatility.
Litecoin (LTC): -23%
The numbers: LTC crashed from $130 to $100. Market cap fell approximately $2-3 billion. Volume increased 180%.
Why it fell: Litecoin is a legacy cryptocurrency without a strong DeFi ecosystem or clear value proposition in 2025's competitive landscape. It's essentially "digital silver" to Bitcoin's "digital gold" - a reasonable narrative in 2013, less compelling in 2025.
LTC typically follows Bitcoin but with amplified volatility. It's a high-beta version of BTC without any of the institutional support, ETF products, or corporate treasury adoption. When Bitcoin falls 12%, Litecoin falls 20-25% because it has all the downside correlation and none of the institutional support.
Significant futures open interest led to liquidation cascades. And concerns about miner profitability at lower prices added to selling pressure - if LTC falls enough, mining becomes unprofitable, hashrate drops, network security decreases, and the death spiral begins.
Solana (SOL): -25% to -30%
The numbers: SOL plummeted from $240 to lows between $150-$182 depending on source and exchange. Market cap fell from over $100 billion to approximately $70-75 billion - a devastating $25-30 billion loss. Volume exploded over 200%.
Why it crashed hard: Solana hosts the largest meme coin ecosystem via Pump.fun, the platform that lets anyone launch a token in minutes. When macro stress hit and Bitcoin crashed, meme coins got absolutely demolished - many falling 50-80% in hours.
When the meme coin ecosystem that represents a huge part of Solana's transaction volume and value proposition collapses, SOL's network value proposition weakens proportionally. If transactions fall, fees fall, network activity falls, and the fundamental case for SOL's valuation takes a hit.
Solana also has historical network stability concerns that resurface during stress. The network has experienced multiple outages in previous years. During the crash, anxiety about potential network stress added to selling pressure - traders worried that high transaction volumes might cause network degradation.
Most critically, SOL had the highest concentration of leveraged positions among major Layer-1 smart contract platforms. The funding rate data showed SOL perpetual futures were even more crowded than Bitcoin's. When liquidations hit, SOL got wrecked harder than almost anything except smaller altcoins.
Solana DEX volume dropped 40% as the crash progressed, indicating declining network activity and user confidence. When the ecosystem is bleeding, the base layer token bleeds too.
XRP: -20% to -30%
The numbers: XRP crashed from $3.10 to lows of $2.40-$2.42. Market cap fell from approximately $110 billion to around $85 billion - a $25 billion loss. Volume increased 120%.
Why it fell: The U.S.-China trade tensions directly threaten XRP's core narrative: cross-border payments. If global trade is contracting due to tariff wars, the demand for cross-border payment infrastructure falls.
Institutional hopes for an XRP ETF - which had been building through 2025 - were suddenly dampened by risk-off sentiment. When markets are crashing, regulators and institutions aren't thinking about launching new crypto products. They're thinking about survival.
Concerns about Ripple's large XRP treasury added pressure. Ripple holds billions of XRP tokens. During market stress, traders worry about the company selling tokens to fund operations - adding supply during a time of falling demand.
On-chain data showed XRP exchange inflows increased 95% during the crash. Millions of tokens moved from private wallets to exchanges - the clearest possible signal of selling pressure. Large holders were dumping.
Ethereum (ETH): -15% to -16%
The numbers: ETH plunged from $4,300-$4,400 to lows between $3,461-$3,761. Market cap fell from over $500 billion to approximately $420-450 billion - a $75-100 billion loss. Liquidations totaled $1.68-2.24 billion, making it the second-most liquidated asset after Bitcoin.
Why it crashed: As the primary DeFi chain, Ethereum bore the brunt of every DeFi protocol liquidation happening simultaneously. Aave liquidations, Compound liquidations, MakerDAO liquidations, GMX liquidations - they all happened on Ethereum and they all added selling pressure to ETH.
Automated smart contract liquidations across dozens of protocols amplified the selling. These aren't emotional retail traders deciding to sell - these are cold, emotionless code executing predetermined liquidation logic. When collateral ratios breach thresholds, smart contracts automatically sell to protect protocol solvency.
Network congestion during the panic drove gas fees to 150+ gwei - multi-month highs that added negative sentiment. High gas fees during a crash create a terrible user experience: you're losing money on your positions AND paying exorbitant fees to do anything about it.
ETH spot ETF flows told a dark story. On October 10, all nine Ethereum ETFs reported zero net inflows. The previous day's positive momentum had completely reversed. Total outflows reached $175 million - institutional money was quietly heading for the exits.
Binance Coin (BNB): -10% to -15%
The numbers: BNB fell from $1,280 to lows around $1,138. Market cap dropped approximately $15-25 billion. Volume increased about 90%.
Why it fell: As Binance's native token, BNB faces selling pressure when traders reduce their exchange exposure during volatility. If you're worried about exchange risk during a crash, you sell your exchange tokens first.
DeFi protocols on BNB Chain (formerly Binance Smart Chain) experienced their own liquidation cascades, adding to the selling pressure. BNB's dual use case - exchange utility token and DeFi ecosystem gas token - meant it faced selling pressure from both sides.
The relatively smaller decline compared to other altcoins reflects BNB's utility value (you need it for trading fee discounts on Binance) and Binance's quarterly token burns, which provide price support by reducing supply.
Bitcoin (BTC): -10% to -12%
The numbers: BTC crashed from the October 10 high of $122,456 to an intraday low of $105,262. From the October 6-7 all-time high of $126,223, the decline was over 16%. Market cap fell from over $2.4 trillion to approximately $2.15 trillion - a loss of more than $250 billion. Liquidations totaled $1.83-2.46 billion, the largest of any asset.
Why even Bitcoin fell: Bitcoin isn't immune to macro shocks, especially when they're this severe. A 130% tariff announcement from the President of the United States representing an existential threat to global trade - that's a macro shock.
Bitcoin had just hit all-time highs days before with record leverage in the system. The classic "buy the rumor, sell the news" dynamic was playing out, except the "news" was far worse than anyone expected.
When BTC broke below $120,000, it triggered cascading stop-losses. Traders who set stops at "safe" levels like $118,000 or $115,000 got stopped out as the market blew straight through those levels.
The largest single liquidation in the entire crash was an $87.53 million BTC/USDT long position on HTX exchange. Someone - or some institution - had bet huge that Bitcoin would keep rising. They were catastrophically wrong.
DeFi's Moment of Truth: When Smart Contracts Met Market Panic
While centralized exchanges were processing the largest liquidation event in history, decentralized finance was facing its own stress test. Would smart contract-based lending protocols accumulate bad debt? Would oracle systems fail to update prices accurately during extreme volatility? Would DeFi prove to be a fair-weather innovation that only works during bull markets?
The answer, surprisingly, was largely positive.
Aave: $210 Million Liquidated, Zero Bad Debt
Aave is the largest DeFi lending protocol with over $68 billion in total value locked across multiple blockchains. During the crash, Aave's automated liquidation system processed over $210 million in liquidations during a comparable stress period.
Here's what's remarkable: despite processing a quarter-billion dollars in emergency liquidations, Aave accumulated zero new bad debt. Not one dollar. The liquidation system worked exactly as designed.
How did it work? When a borrower's collateral ratio drops below the liquidation threshold (typically around 82-83% for most assets), Aave's liquidation smart contracts automatically trigger. Liquidators - specialized actors who monitor the system looking for liquidation opportunities - can purchase the borrower's collateral at a discount (usually 5-10%) and use it to pay off the loan.
The liquidator makes a profit from the discount. The protocol remains solvent because loans get repaid. The borrower loses their collateral but at least their debt is cleared. It's a remarkably elegant system - and during crypto's worst liquidation event ever, it worked perfectly.
This is a massive maturity signal for DeFi. In previous crashes, DeFi protocols accumulated significant bad debt because liquidations couldn't process fast enough or liquidators weren't incentivized properly. In October 2025, the system held.
MakerDAO: DAI Stability Through the Storm
MakerDAO's DAI stablecoin - the largest decentralized stablecoin with over $5.36 billion in circulation - faced a critical test. Would DAI maintain its dollar peg during the liquidation cascade? The answer: absolutely.
Throughout the entire crash, DAI traded in a range of $0.9992 to $1.0005. That's essentially perfect peg maintenance. For comparison, during the March 2020 COVID crash, DAI briefly depegged to $1.09 as the system struggled to process liquidations and the ETH price fell so fast that the oracle system lagged.
In October 2025, no such issues emerged. MakerDAO's Liquidation 2.0 system, which replaced the older auction-based mechanism with a more efficient Dutch auction model, processed liquidations smoothly. The protocol's over-collateralization model proved robust even during extreme stress.
No bad debt was accumulated. The system maintained solvency. And most importantly for ecosystem stability, DAI holders never panicked - there was no run on redemptions, no depegging spiral, no contagion to other stablecoins.
Compound: The Absorb Mechanism Performs
Compound, one of DeFi's original lending protocols, has evolved its liquidation mechanism over recent versions. Compound III introduced an "absorb" mechanism where underwater borrower positions are transferred to the protocol itself, which then auctions off the collateral.
Historical data shows Compound processed approximately $80 million in liquidations during comparable periods of market stress. While exact October 10-11 figures weren't immediately available, on-chain data showed no unusual bad debt accumulation or protocol distress.
The absorb mechanism's advantage is that it doesn't rely on external liquidators acting quickly. The protocol itself takes ownership of troubled positions and can manage the unwind more systematically. During a crash, this provides more stability than mechanisms that depend on liquidators acting in real-time during chaotic conditions.
Oracle Systems: The Critical Infrastructure That Didn't Fail
Perhaps the most critical infrastructure test was for oracle systems - specifically Chainlink, which provides price feeds for the vast majority of DeFi protocols.
If oracles fail to update prices accurately during extreme volatility, the consequences are catastrophic. Protocols make decisions about liquidations based on oracle prices. If those prices are stale or inaccurate, protocols either liquidate too early (unfair to users) or too late (accumulating bad debt).
During the October 10-11 crash, Chainlink's oracle network functioned without failures or significant delays. Price feeds updated continuously, providing accurate data to protocols even during peak volatility when prices were updating multiple times per second.
This is a huge deal. Chainlink supports over $93 billion in on-chain value across 60+ blockchains and thousands of smart contracts. A failure during the largest liquidation event ever would have been disastrous - potentially causing cascading protocol failures across the entire DeFi ecosystem.
The fact that it worked flawlessly is a major validation of decentralized oracle architecture. Centralized price feeds have single points of failure. Decentralized oracle networks proved they can handle extreme stress.
DEX Performance: Uniswap and Curve Hold Steady
Decentralized exchanges faced their own challenges: would liquidity providers pull liquidity during the panic? Would automated market makers face catastrophic losses? Would slippage become so severe that DEXs became unusable?
Uniswap, the largest DEX, maintained its 50-65% market share of weekly volume throughout the crash. Its concentrated liquidity model (introduced in v3 and refined in v4) meant that liquidity providers had positioned capital efficiently around current price ranges.
When prices moved violently, LPs did face impermanent loss - the inevitable consequence of providing liquidity during volatility. But the system remained functional. Traders could still execute swaps. Liquidity didn't vanish entirely.
Curve Finance, designed specifically for stablecoin and correlated asset swaps, maintained its role as DeFi's liquidity backbone. With $2.48-2.61 billion in TVL, Curve's StableSwap algorithm kept slippage minimal on stable pairs throughout the chaos.
No major DEX pool imbalances were reported. No smart contract exploits emerged during the confusion. The decentralized exchange infrastructure - built on immutable smart contracts and automated market making - proved robust.
Hyperliquid: The DEX That Made History (And Someone Rich)
Hyperliquid, a decentralized perpetual futures exchange, recorded the largest single DEX liquidation in history: a $203 million ETH/USDT long position. Multiple other liquidations in the $15-20 million range also processed through the platform.
But here's where things get interesting - and potentially sketchy. One whale trader on Hyperliquid opened over $1 billion in short positions hours before Trump's tariff announcement. When the market crashed, this trader reportedly profited approximately $190-200 million.
The timing was suspiciously perfect. Did this trader have advance knowledge of Trump's announcement? Was it just incredible luck? Or sophisticated analysis of market positioning and trade war dynamics?
We don't know. But when someone makes $200 million on a trade with timing that precise, people ask questions.
The Stablecoin Surprise: Perfect Pegs During Chaos
If you've been around crypto for a while, you remember the stablecoin panics. You remember when Tether depegged to $0.90 in 2018. You remember USDC falling to $0.87 during the March 2023 Silicon Valley Bank crisis. You remember the Terra/UST collapse where a $1 "stablecoin" went to $0.10 in days.
So when the largest liquidation event in crypto history hit on October 10-11, everyone watching stablecoins was nervous. Would USDT hold? Would USDC crack? Would panicked traders rush to redeem billions of stablecoins, creating a bank run that could destroy the entire ecosystem?
None of that happened.
USDT: Perfect Peg, Massive Volume
Tether's USDT, with a market cap of $177-179 billion, held its dollar peg perfectly throughout the entire crash. The token traded in a tight range around $1.00 with minimal deviation - exactly what a stablecoin should do.
But here's what's remarkable: trading volume exploded by 152% to over $328 billion in 24-hour volume. Think about what that means. During the crash, traders weren't redeeming USDT - they were buying it.
This was flight-to-safety behavior. As Bitcoin and Ethereum crashed, traders sold their volatile assets and held the proceeds in USDT. That's exactly what stablecoins are designed for: providing a stable dollar-denominated safe haven during crypto volatility.
The surge in USDT volume actually increased demand for the token rather than triggering redemptions. More demand means more buying pressure, which if anything helps support the peg rather than threatening it.
Tether's reserves - which now include $113 billion in U.S. Treasury securities - provided confidence that redemptions could be honored if needed. The company has consistently published attestations showing over-collateralization. During the crash, no one questioned whether Tether could honor redemptions.
USDC: Circle's Moment of Validation
Circle's USDC, with a market cap of $74-75 billion, held its peg even more tightly than USDT. Throughout the crash, USDC traded in a range of $0.9998 to $1.0005. That's essentially perfect.
Volume increased 167% to $51+ billion - again, demonstrating flight-to-safety behavior rather than redemption panic.
For Circle, this was a moment of validation. The company had faced existential questions during the SVB crisis in March 2023, when $3.3 billion of USDC's reserves were trapped in Silicon Valley Bank over a weekend. USDC depegged to $0.87 as panic spread about whether Circle could honor redemptions.
That crisis led Circle to restructure its reserves entirely into U.S. Treasury bills held at segregated custodians. No bank deposits. No corporate bonds. Just the safest, most liquid assets in the world.
The October 2025 crash proved the strategy worked. When crypto faced its worst liquidation event ever, USDC holders didn't panic. They trusted the reserves. The peg held.
Why 2025 Was Different
The stark contrast between 2025's stablecoin stability and previous crises reveals how much the market has matured:
Better Reserve Quality: Both Tether and Circle now hold primarily U.S. Treasuries - the most liquid, safe assets in the world. In 2018, Tether's reserves were murky and included commercial paper and other questionable assets. In 2025, transparency and quality are dramatically improved.
Regulatory Clarity: The GENIUS Act, passed in July 2025, established the first comprehensive federal stablecoin framework. Issuers know the rules. Regulators have clear oversight. The legal ambiguity that created panic in previous years has been largely resolved.
Market Maturity: The stablecoin market has grown to nearly $300 billion across multiple issuers. Deeper liquidity, more arbitrage traders, better market-making infrastructure - all contribute to peg stability during stress.
Flight-to-Safety Dynamics: In 2018-2023, stablecoin panics often stemmed from fears about crypto itself collapsing. In 2025, the crash was triggered by external macro factors (tariffs). Traders wanted to exit volatile crypto positions but stay in crypto-dollar equivalents. That meant buying stablecoins, not redeeming them.
The October 2025 crash was the stress test stablecoins needed to prove they work during real crises. They passed.
Institutional Money: The Pre-Crash Euphoria and Post-Crash Questions
The institutional adoption story of 2024-2025 had been Bitcoin's defining narrative. BlackRock's IBIT ETF became one of the most successful ETF launches in history. Pension funds began allocating to crypto. Corporate treasuries bought Bitcoin. Crypto had "made it."
Then came October 10.
The ETF Inflow Tsunami
Leading into the crash, institutional money had been flooding into crypto - particularly through Bitcoin and Ethereum ETFs.
Bitcoin ETFs:
- October started with a bang: $3.5 billion in net inflows in just the first four trading days
- October 7: BlackRock's IBIT alone recorded $899.47 million in single-day inflows
- October 8: Bitcoin ETFs collectively saw $1.21 billion in net inflows
- Year-to-date through October 9: $25.9 billion in cumulative inflows
- BlackRock's IBIT crossed 800,000 BTC in assets (approximately $97 billion) on October 8
Ethereum ETFs:
- October inflows through October 6: $621.4 million total
- More than doubled September's $287.5 million
- Cumulative net assets across all Ethereum ETFs: $29.72 billion
These weren't retail numbers. This was institutional capital - pension funds, hedge funds, family offices, RIAs allocating client capital. Real money from real institutions building real positions.
And the timing was catastrophically bad.
October 9: The Warning Sign Everyone Ignored
On October 9 - the day before the crash - something interesting happened. Bitcoin ETFs recorded $197.68 million in inflows. Solid, but well below recent days' numbers. But Ethereum ETFs told a different story: $8.54 million in outflows, breaking an eight-day inflow streak.
Was this a warning signal? Were sophisticated institutional investors quietly heading for the exits while retail was still buying?
We'll never know for certain. But in hindsight, that flow reversal on Ethereum ETFs looks prescient.
The Weekend Timing Problem
When Trump dropped his tariff bomb at 5:08 PM on Friday, traditional markets were closed. More importantly, ETF markets were closed. No institutional buying could come in to support prices, even if institutions wanted to.
BlackRock's IBIT, which had just crossed $97 billion in assets, watched helplessly as Bitcoin crashed 12%. By Saturday's lows, that AUM had shrunk to approximately $87-90 billion. Fidelity's FBTC, VanEck's HODL, all the spot Bitcoin ETFs - they all suffered similar paper losses.
But they couldn't do anything about it. No trading. No rebalancing. No buying the dip. Just watching.
Ethereum ETFs faced the same problem. From cumulative assets of $29.72 billion, estimated losses of 16% would have reduced AUM to around $25 billion at the crash lows.
The Monday Question
The most important question for Bitcoin's price trajectory in the week following the crash is simple: What do institutional investors do Monday morning when markets reopen?
Three scenarios:
Scenario 1: Panic Selling If institutions view the tariff situation as fundamentally changing crypto's risk profile and decide to reduce exposure, we could see massive ETF outflows on Monday. Billions leaving Bitcoin and Ethereum ETFs would add enormous selling pressure and potentially drive another leg down.
This seems unlikely given the macro cause of the crash, but it's possible if institutional risk officers mandate reduced exposure to volatile assets.
Scenario 2: Hold Steady Institutions could simply do nothing - acknowledging the loss but maintaining allocation targets and viewing the crash as temporary macro volatility. This would likely result in modest outflows as some weak hands exit, balanced by some opportunistic buying.
This is probably the base case. Most institutions have defined allocation targets and don't make major changes based on short-term volatility.
Scenario 3: Buy the Dip If institutions view $105,000-$110,000 Bitcoin as an attractive entry point - especially if they believe the tariff situation will eventually be resolved - we could see renewed inflows. "Buy fear" is a classic institutional strategy.
This is the bullish case. If BlackRock's IBIT records $500+ million in net inflows on Monday, that would signal institutional confidence and likely support a recovery.
Monday October 13's ETF flow data will be the most important market data point of the week.
Regulatory Silence: The Dog That Didn't Bark
As Saturday afternoon turned into evening on October 11, something remarkable was happening - or more accurately, not happening.
Despite the largest liquidation event in cryptocurrency history, wiping out $19 billion in positions and affecting 1.6 million trader accounts, not a single major U.S. regulatory agency had issued any public statement.
The Securities and Exchange Commission? Silent.
The Commodity Futures Trading Commission? Nothing.
The Treasury Department? No comment.
The White House? Radio silence.
Congress? Not a peep.
Major international regulators in Europe and Asia? Also quiet.
Why the Silence Matters
Contrast this with previous major crypto crises:
FTX Collapse (November 2022):
- SEC announced investigation within 48 hours
- CFTC issued statement about customer fund protections
- Congressional hearings announced within a week
- International regulators issued warnings
Terra/Luna Collapse (May 2022):
- Treasury Secretary Janet Yellen testified to Congress about stablecoin risks
- SEC expanded investigative authority
- Multiple state regulators launched probes
March 2020 COVID Crash:
- Fed issued statements about financial stability
- Multiple agency coordination on market support
- Congressional action on economic relief
Yet in October 2025, after a $19 billion liquidation event - nothing.
Five Reasons for the Regulatory Silence
- Weekend Timing The crash occurred Friday evening through Saturday morning. Government offices are closed. Staff are home with their families. Emergency responses take time to coordinate.
That said, the FTX collapse also happened on a Friday and regulators issued statements by Monday. The weekend excuse only goes so far.
- Government Shutdown The U.S. federal government entered shutdown on October 1, 2025 due to budget impasse. Many agencies were operating with skeleton crews, handling only essential functions.
Regulatory analysis of crypto market events arguably isn't "essential" in the legal sense, even if a $19 billion wipeout feels pretty essential to the 1.6 million people who got liquidated.
- Attribution to Trade Policy The crash was triggered by President Trump's tariff announcement - a deliberate government policy action. It wasn't fraud. It wasn't an exchange failure. It wasn't market manipulation.
When the government's own policy causes a market crash, what exactly are regulators supposed to say? "We're investigating the market impact of our boss's decision"? That's awkward.
- Pro-Crypto Administration The Trump administration has positioned itself as explicitly pro-crypto:
- CFTC Acting Chairman Caroline Pham announced a "Crypto Sprint" on August 1, 2025 focused on "making America the crypto capital of the world"
- SEC Chairman Paul Atkins established a Crypto Task Force led by Commissioner Hester Peirce with a mission to "support innovation"
- Treasury Secretary Scott Bessent gave remarks on July 30 about "Building the Golden Age of Crypto"
- Trump signed an Executive Order on March 6 establishing a Strategic Bitcoin Reserve
When your political priorities include promoting crypto adoption, publicly criticizing the industry during a crisis - even one this large - creates awkward optics.
- Infrastructure Held Perhaps most importantly: despite $19 billion in liquidations, the crypto market's infrastructure mostly worked.
Major exchanges remained operational. No Mt. Gox-style collapses. No missing customer funds. No exchange insolvencies. Stablecoins held their pegs. DeFi protocols processed liquidations without accumulating bad debt. Oracle systems functioned without failures.
Yes, 1.6 million people lost money. Yes, it was brutal. But from a systemic stability perspective - which is what regulators ultimately care about - the system absorbed the shock and kept functioning.
When everything breaks, regulators need to step in. When everything works (even if it's ugly), maybe they don't.
What Regulators Are Probably Thinking (But Not Saying)
Behind closed doors, you can imagine the regulatory conversations:
The Bull Case (Pro-Crypto Regulators): "The market worked. People using excessive leverage got liquidated - that's exactly what's supposed to happen. Stablecoins held pegs. Exchanges processed orders. DeFi protocols remained solvent. This proves crypto infrastructure is mature enough to handle stress."
The Bear Case (Skeptical Regulators): "1.6 million people lost their money in eight hours because exchanges offer 200x leverage and nobody stops them. This is casino capitalism. We need position limits, leverage restrictions, and circuit breakers."
The Pragmatic Middle: "It's a $19 billion mess triggered by macro factors, but no systemic risks emerged. We'll monitor for any delayed fallout - exchange insolvencies, DeFi protocol failures, stablecoin stress. If those emerge, we'll act. If not, this was just an expensive lesson about leverage."
Based on the silence, it seems the pragmatic middle is winning.
Market Structure: What Broke and What Held
The October 10-11 crash provided the most intense stress test crypto markets have ever faced. $19 billion in liquidations is unprecedented. So what does it reveal about market structure - the strengths, weaknesses, and vulnerabilities of crypto markets in 2025?
What Broke: Critical Weaknesses Exposed
- Excessive Leverage Remains Systemic
Despite every previous crash, despite every "lesson learned," exchanges are still offering 100-200x leverage on Bitcoin and Ethereum futures. This is insane.
Funding rates above 8% before the crash - versus normal rates of 0.01-0.03% - showed extreme positioning. When 87% of liquidations are long positions, that's not a diversified market. That's a crowded trade waiting to explode.
The $19 billion figure represents approximately 20% of total derivatives open interest being forcibly closed in less than 24 hours. Think about that. One-fifth of all leveraged positions in the entire crypto market wiped out in a day.
No other financial market operates with such extreme leverage available to retail traders. You can't get 100x leverage on Apple stock. You can't get 200x leverage on gold. The fact that crypto exchanges offer this is enabling gambling, not trading.
- Liquidity Fragmentation and Weekend Vulnerability
The crash occurred Friday evening into Saturday - the worst possible timing. Traditional markets closed. ETF markets closed. Institutional buying support completely absent.
What liquidity remained was badly fragmented across dozens of exchanges with order books that evaporated during peak selling. Average order book depth for top altcoins is typically only $1-5 million within 2% of mid-market. During the crash, that depth collapsed to a fraction - maybe $200,000-$500,000 on smaller tokens.
When order books are that thin, selling pressure causes dramatic price moves. A $1 million sell order in normal conditions might move price 0.5%. During the crash, the same order moved prices 5-10%.
Market makers pulled back to manage their risk, creating a liquidity vacuum exactly when liquidity was most needed. This is rational from their perspective - you don't want to catch a falling knife when you can't hedge your exposure - but it turns normal corrections into crashes.
- Cross-Margin Contagion
Binance experienced dramatic, brief depegging events in several assets during the crash:
- USDE (Ethena's synthetic dollar) dropped to $0.6567
- BNSOL (Binance's wrapped Solana token) fell to $34.9 from $211+
- WBETH (Wrapped Beacon ETH) hit $430.65 from $3,700+
These weren't actual asset collapses. They were artifacts of cross-margin liquidations where traders using one account to margin multiple positions saw everything liquidated simultaneously when Bitcoin fell.
When Bitcoin drops and triggers a margin call, the exchange liquidates not just your BTC position but also your ETH, SOL, BNB, and every other holding in that account. If you're holding a relatively illiquid wrapped asset like WBETH, forced selling into thin order books creates price dislocations.
This cross-margin contagion is dangerous because it spreads stress from one asset across entire portfolios, amplifying market-wide volatility.
- Potential Whale Manipulation
The Hyperliquid whale who opened over $1 billion in short positions just hours before Trump's tariff announcement and profited ~$190-200 million raises serious questions.
Was this:
- Incredible timing and sophisticated analysis of trade war dynamics?
- Advance knowledge of Trump's announcement (insider trading)?
- Manipulation where the whale somehow influenced the timing?
We don't know. But when someone makes $200 million with timing that precise, it erodes confidence in market fairness. Retail traders who got liquidated might reasonably wonder: is this market rigged against us?
What Held: Signs of Maturity
Despite these weaknesses, several critical components of crypto infrastructure passed the stress test.
- Exchange Infrastructure Remained Operational
This cannot be overstated: despite processing $19 billion in forced liquidations in less than 24 hours, major centralized exchanges remained operational.
Binance, Coinbase, Kraken, Bybit, OKX - all processed billions in orders without catastrophic failures. Systems strained but didn't break. Customer funds remained segregated and secure. No Mt. Gox-style collapse. No FTX-style fraud revealed.
Yes, there were brief delays and high latency during peak volumes. Yes, some users couldn't access accounts for minutes. But the core infrastructure held. That's a massive achievement given the unprecedented stress.
- DeFi Protocols Proved Resilient
Aave processed $210+ million in liquidations with zero bad debt. MakerDAO maintained DAI's peg throughout. Compound's systems functioned as designed. Chainlink's oracles provided accurate, timely price data without failures.
These aren't trivial accomplishments. Smart contract-based lending protocols faced a test that would have destroyed them in 2020-2021. In 2025, they passed.
DeFi's transparency is also worth noting. Every liquidation is visible on-chain. Every transaction is auditable. When centralized exchanges report liquidation data, you trust their numbers. When DeFi protocols liquidate positions, you can verify it yourself on Etherscan.
- Stablecoin Stability Was Perfect
USDT and USDC held their dollar pegs throughout the largest liquidation event in crypto history. This is a game-changer.
If stablecoins had depegged - if USDT had fallen to $0.90 or USDC had dropped to $0.85 - the contagion would have been catastrophic. Panic would have fed on itself. The entire crypto ecosystem could have faced an existential crisis.
Instead, stablecoins served their designed purpose: providing a stable safe haven during volatility. Traders sold Bitcoin and held USDT. Sold Ethereum and held USDC. The flight-to-safety behavior actually increased stablecoin demand rather than triggering redemptions.
This validates years of infrastructure development, reserve management improvements, and regulatory clarity from the GENIUS Act.
- No Contagion to Traditional Finance
The crypto crash remained contained within crypto. No major banks faced losses from crypto exposure. No hedge funds announced blow-ups. No pension funds required bailouts.
Traditional financial markets experienced volatility from the tariff news itself, but crypto's problems stayed in crypto. This decoupling - or more accurately, the lack of contagion - shows that crypto's integration with traditional finance hasn't created systemic risks yet.
Critics often warn that crypto could trigger a financial crisis. October 10-11 showed that at least for now, crypto can experience its own crisis without dragging everything else down with it.
Investor Psychology: From Greed to Fear in 48 Hours
Markets are driven by two primal emotions: greed and fear. The October 10-11 crash provided a textbook case study in how quickly sentiment can shift - and how brutal the transition can be.
The Fear & Greed Index: 70 to 35
One of the most watched crypto sentiment indicators is the Crypto Fear & Greed Index, which aggregates various data points (volatility, volume, social media sentiment, dominance, trends) into a single number from 0 (Extreme Fear) to 100 (Extreme Greed).
On October 9, the day before the crash, the index read 70 (Greed). Optimism was high. Bitcoin had just hit new all-time highs. ETF inflows were setting records. "Uptober" was trending on social media - the narrative that October is traditionally Bitcoin's best month.
By October 11, the index had plunged to 35 (Fear). A 35-point swing in under 48 hours.
This represents one of the fastest sentiment reversals in crypto history. For context, the index fell from around 60 to 10 during the March 2020 COVID crash, but that took over a week. This was a two-day collapse in sentiment.
Social Media: From Moon Boys to Loss Porn
The shift in social media discourse was whiplash-inducing.
Pre-Crash Discourse (October 1-9):
- "Uptober baby! New ATH incoming 🚀"
- "I just leveraged my entire portfolio, let's ride this to $150K"
- "The bull market is just getting started"
- "If you're not 50% crypto right now you're missing out"
- "Everyone I know is finally asking about Bitcoin again"
During/Post-Crash (October 10-11):
Trader Pentoshi, a widely-followed crypto analyst, captured the mood: "I know there are a lot of emotions right now and this flush is in the top 3 all time. There are a lot of people in incredible pain right now, myself included."
Zaheer Ebtikar, CIO of Split Capital: "The altcoin complex got absolutely eviscerated. Full leverage reset and market dislocation."
Reddit's cryptocurrency forums filled with "loss porn" - screenshots of liquidated positions, often with dark humor masking genuine financial devastation. One post showed a $450,000 portfolio liquidated down to $3,200. Another showed a $1.2 million position completely wiped out.
Twitter became a real-time chronicle of panic:
- "Just got liquidated. Wife doesn't know yet. What do I do?"
- "Lost my entire stack. 5 years of accumulation gone in one night."
- "I can't believe I thought 100x leverage was a good idea"
- "This is why I have trust issues with crypto"
The Recency Bias Trap
What happened to investor psychology in early October is a classic case of recency bias - the tendency to overweight recent experiences when making decisions about the future.
Bitcoin hits $126K on October 6-7? Obviously it's going to $150K next.
ETF inflows hit record levels? Obviously institutional adoption is accelerating.
Every time you check your portfolio it's worth more than before? Obviously leverage makes sense.
This is how bubbles form. Not through fraud or manipulation, but through the subtle psychological trick where recent positive outcomes convince you that positive outcomes are more likely than they actually are.
Professional traders talk about "fighting the last war" - preparing for the previous crisis while missing the next one. Retail traders in early October were fighting the 2022 bear market, convinced that this time was different. It was different - just not in the way they expected.
On-Chain Sentiment Indicators
Blockchain data revealed the psychological shift in cold, hard numbers.
Bitcoin Exchange Flows: Exchange inflows increased 140% during the crash. In just four hours, over 15,000 BTC moved from private wallets to exchanges - the clearest possible signal of panic selling. When people move Bitcoin to exchanges, they're preparing to sell.
Exchange outflows - moving BTC off exchanges to cold storage, suggesting long-term holding - collapsed to near-zero. Nobody was buying for the long term. Everyone was trying to preserve capital or cut losses.
Ethereum Holder Behavior: Over $2 billion in ETH was deposited to exchanges during the crash - the highest level since May 2025. Large holders (addresses with >10,000 ETH) reduced positions by approximately 8%.
These aren't retail investors. These are whales - early adopters, miners, institutions, or foundations. When whales sell during panic, it signals capitulation.
XRP Panic Selling: XRP exchange inflows increased 95%, with millions of tokens moving from wallets to exchanges. The on-chain data matched the price action: holders were dumping.
The FOMO-to-Panic Pipeline
There's a predictable psychological pipeline in crypto:
Stage 1: Skepticism "Bitcoin is a scam. No thanks." (Bitcoin $20,000)
Stage 2: Interest "Okay maybe there's something here, but I'll wait for a better entry." (Bitcoin $50,000)
Stage 3: FOMO "Everyone's making money except me. I need to get in NOW." (Bitcoin $120,000)
Stage 4: Euphoria "I'm a genius. I should quit my job and trade full-time." (Bitcoin $126,000 ATH)
Stage 5: Denial "This is just a healthy correction. We'll be back at ATH tomorrow." (Bitcoin $115,000)
Stage 6: Panic "Oh God I'm down 15%. SELL EVERYTHING." (Bitcoin $105,000)
Stage 7: Capitulation "Crypto is dead. I'll never touch this shit again." (Bitcoin $95,000-100,000? TBD)
The October crash caught thousands of traders somewhere between Stages 4 and 6. Many had bought at or near all-time highs in the $120,000-126,000 range, potentially using leverage to maximize gains.
When prices fell 12-15%, they faced a choice: take the loss and exit, or hold and hope for recovery. Those using high leverage didn't get the choice - the market liquidated them automatically.
What Happens Next: Four Potential Paths Forward
The trillion-dollar question: where does crypto go from here?
Let's examine four potential scenarios, their probability, requirements, and timelines.
Scenario 1: V-Shaped Recovery (20-30% probability)
What it looks like: Bitcoin bounces back to $120,000+ within 1-2 weeks. Quick recovery. By end of October, prices are near or above pre-crash levels. By December, new all-time highs.
Requirements:
- Trade war de-escalates quickly (Trump and Xi reach compromise)
- Monday ETF flows show strong institutional buying ("buy the dip")
- No additional macro shocks
- Technical support at $105,000 holds firm
- Funding rates normalize without additional liquidations
Key signals to watch:
- Monday October 13 ETF flows (critical)
- Trump's social media for any trade war softening
- Bitcoin holding above $110,000 through weekend
- Funding rates recovering to positive but sustainable levels (0.01-0.03%)
- Exchange reserves declining (Bitcoin moving off exchanges)
Timeline: 1-2 weeks to pre-crash levels, new ATH potentially by end of Q4 2025
Why it might happen: Previous Bitcoin crashes have often seen V-shaped recoveries when the fundamental bull thesis remains intact. If the market views $105,000-110,000 as an attractive entry point and institutional money agrees, buying pressure could quickly overwhelm the liquidated supply.
Why it might not: Trade war escalation is hard to predict. Trump's strategy is unpredictable. China's response could be worse than expected. And massive leveraged positions just got wiped out - it takes time for new leverage to build.
Scenario 2: Gradual Recovery with Consolidation (50-60% probability) [BASE CASE]
What it looks like: Bitcoin consolidates in the $95,000-$115,000 range for 4-8 weeks. Multiple tests of support and resistance. Slow, choppy recovery. Eventually breaks higher in late November/December, potentially reaching $130,000-$150,000 by year-end.
Requirements:
- Trade tensions remain elevated but don't dramatically worsen
- ETF flows stabilize (modest outflows or neutral, then gradually positive)
- No additional major macro shocks
- Time for leverage to reset and confidence to rebuild
- Technical indicators to stabilize and show accumulation
Key signals to watch:
- ETF flows over multiple weeks (trend matters more than single days)
- Bitcoin's ability to hold $95,000-$100,000 support zone
- Funding rates staying near zero or slightly positive
- Short-Term Holder SOPR (realized profit/loss indicator)
- Accumulation Trend Score from on-chain analytics
Timeline:
- Week 1-2: Consolidation $105,000-$115,000
- Week 3-4: Testing support, possibly down to $95,000-$100,000
- Week 5-6: Base building, accumulation phase
- Week 7-10: Gradual recovery toward $120,000
- Week 11-14: Break above previous ATH, potential $130,000-$150,000
Why this is base case: This matches historical patterns after major liquidation events. The leverage needs time to reset. Sentiment needs time to heal. Traders who got burned need time to lick their wounds before re-entering.
Zaheer Ebtikar laid out a similar timeline: "Market bleeds and market makers pause (24-48 hours) → Data feeds stabilize (2-3 days) → Market stabilization (3-7 days) → Market finds floor (1-2 weeks)."
His framework suggests a 2-4 week bottoming process, which aligns with this gradual recovery scenario.
Why it might be wrong: Could underestimate either upside (V-shaped recovery) or downside (prolonged bear) if macro situation evolves faster than expected.
Scenario 3: Prolonged Bear Market (15-20% probability)
What it looks like: Bitcoin breaks below $95,000 support decisively. Cascading technical breakdowns lead to further selling. Price reaches $75,000-$85,000 range. Multi-month recovery process (6-12 months). Possible retest of 2024 highs around $73,000 before eventual recovery.
Requirements:
- Significant trade war escalation (China retaliates with own tariffs/controls)
- U.S. recession develops in Q4 2025 or Q1 2026
- Major exchange failure or DeFi protocol collapse (delayed consequences from crash)
- Additional regulatory crackdown from unexpected source
- ETF outflows accelerate and continue for weeks
Catalysts that could trigger:
- Trump escalates beyond 130% tariffs
- China bans rare earth exports entirely
- Major economic data shows recession (GDP, unemployment)
- Crypto-specific black swan (exchange hack, major protocol exploit)
- Regulatory emergency action (unlikely but possible)
Key signals to watch:
- Break below $95,000 with high volume
- ETF outflows exceeding $1 billion per week consistently
- Short-Term Holder Cost Basis breaking down (currently around $117,000)
- Funding rates staying deeply negative (indicating crowd shorts)
- Traditional markets entering bear market (S&P 500 down 20%+)
Timeline: 3-6 months to reach bottom ($75,000-$85,000), 6-12 months total for recovery back to pre-crash levels
Why it could happen: The macro environment is genuinely concerning. 130% tariffs could trigger recession. If recession hits while crypto is already wounded, a prolonged bear becomes much more likely.
The crypto market is still young and prone to boom-bust cycles. Just because we had a bull market in 2024-2025 doesn't mean another bear market is impossible.
Why it probably won't: Institutional infrastructure is much stronger in 2025 than previous cycles. Bitcoin ETFs hold ~$97 billion in assets. Corporate treasuries hold Bitcoin. The support structure is more robust. Previous bears were driven by crypto-specific disasters (Mt. Gox, ICO crash, exchange failures). This crash was macro-driven - if macro improves, crypto should too.
Scenario 4: Regulatory Clampdown (5-10% probability)
What it looks like: U.S. regulators (CFTC, SEC, Treasury) announce emergency measures in response to crash: mandatory leverage limits (25x maximum), position limits for retail traders, circuit breakers for extreme volatility, margin requirement increases, mandatory insurance funds. Implementation over 6-12 months. Market impact uncertain - could be initially negative then stabilizing.
Requirements:
- Political will to act (currently absent given pro-crypto administration)
- Public pressure about consumer harm (1.6 million liquidations)
- Additional failures or issues emerging from crash aftermath
- Congressional hearings revealing systemic concerns
- Coordination between multiple regulatory agencies
Catalysts:
- Delayed exchange insolvencies from crash losses
- Consumer complaints reaching critical mass
- Media coverage highlighting human costs (retirement savings lost, suicides)
- Political winds shifting against crypto
- International regulatory pressure (G20, IMF)
Timeline: Proposals 1-3 months, comment periods and hearings 3-6 months, implementation 6-12 months
Why it probably won't happen: Current administration is explicitly pro-crypto. Trump wants America to be "crypto capital of world." Agencies are focused on enabling innovation, not restricting it. The crash was bad but infrastructure held - regulators may view this as "markets working" rather than market failure.
Why it might: 1.6 million people lost money in eight hours. Some lost life savings. If media coverage shifts from "biggest liquidation ever" to human interest stories about financial devastation, political pressure could build. Regulators often act in response to public outcry more than market data.
What Should Traders Do Now? Practical Takeaways
You've read a lot about the October 10-11 crash. Now what?
Here are practical, actionable takeaways for different types of market participants:
For Retail Traders
- Leverage Kills - Seriously, Stop
This cannot be said enough. The 1.6 million liquidated accounts are not statistics - they're real people who lost real money, often money they couldn't afford to lose.
If you're using more than 3-5x leverage, you're gambling, not trading. If you're using 50x or 100x leverage, you're not even gambling - you're just giving your money away with extra steps.
Yes, leverage amplifies gains on the way up. But it amplifies losses on the way down, and during crashes, losses come much faster than gains ever did.
Action item: If you currently have leveraged positions, reduce them. Take profits. Reduce leverage. Trade with capital you can afford to lose.
- Weekend Vulnerability is Real
The crash happened Friday evening into Saturday - the worst possible timing. Traditional markets closed, ETF markets closed, liquidity thin, volatility extreme.
If you're holding leveraged positions Friday night, you're exposed to maximum risk with minimum support. Consider closing or dramatically reducing positions before weekends, especially during uncertain macro environments.
Action item: Review your portfolio every Friday. Ask: "Am I comfortable holding these positions through the weekend if another Trump tweet drops?"
- "Greed" Readings Are Warnings
The Crypto Fear & Greed Index at 70+ preceded the crash. Extreme greed should trigger risk reduction, not FOMO.
When everyone is euphoric, when social media is full of moon boys, when your barber is asking about altcoins - that's when you should be taking profits, not adding leverage.
Action item: Check the Fear & Greed Index weekly. When it's above 70, start reducing risk. When it's below 30, consider adding.
- Stablecoins Are Your Friend
During the crash, the smart move was selling volatile assets and holding stablecoins. USDT and USDC held their pegs perfectly - they did exactly what they're supposed to do.
Don't be afraid to sit in stablecoins during uncertainty. You're not missing out by holding cash. You're preserving capital and maintaining optionality.
Action item: Keep 20-30% of your crypto portfolio in stablecoins. It provides dry powder for opportunities and psychological comfort during volatility.
- Stop-Losses Are Not Optional
Many traders skip stop-losses because "Bitcoin always recovers." That might be true over months or years, but during a crash, the mark-to-market losses can force you to sell at the worst possible time anyway.
Set stop-losses at levels where you'd legitimately want to exit (not where liquidation forces you). You can always buy back if you're wrong.
Action item: Every position needs a stop-loss. No exceptions. If you can't stomach the stop-loss level required for your position size, your position is too large.
For Institutional Investors
- ETF Timing Risk is Real
The record $2.2 billion weekly inflows immediately preceding the crash is a lesson in flow analysis. Extreme flows in one direction often precede reversals.
Consider dollar-cost averaging into positions rather than making large lump-sum purchases during euphoric periods.
Action item: Review allocation processes. Build in contrarian indicators. When flows are extreme in one direction, pause and reassess.
- Derivatives Infrastructure Held
Despite $19 billion in liquidations, major exchanges processed orders without systemic failures. This is important validation for institutional participation.
The infrastructure is more robust than critics claim. But due diligence on exchange partners remains critical.
Action item: Review exchange counterparty risk assessments. Ensure custody is segregated. Verify insurance fund adequacy.
- DeFi Passed Stress Test
Aave's zero bad debt despite $210 million in liquidations is a major endorsement for DeFi lending protocols. Institutional allocators should pay attention.
Smart contract-based protocols demonstrated resilience that some skeptics didn't think possible.
Action item: Re-evaluate DeFi allocations. Protocols like Aave, Compound, and MakerDAO showed they can handle stress.
- Stablecoin Framework Works
The GENIUS Act's stablecoin regulatory framework contributed to USDT and USDC stability during the crash. Regulatory clarity helps.
Institutions should feel more confident in stablecoin use cases after this stress test.
Action item: Expand stablecoin utilization for treasury management, payment rails, and DeFi interactions where appropriate.
- Macro Correlation is Increasing
Bitcoin's correlation with Nasdaq continues to strengthen. This is not a portfolio diversifier - it's a risk amplifier.
Position sizing should account for crypto's high-beta nature relative to tech equities.
Action item: Stress test portfolios for scenarios where tech stocks and crypto crash simultaneously (because they do).
For Exchanges and Protocols
- Leverage Limits Need Industry Consensus
Offering 100-200x leverage to retail traders is irresponsible. Yes, it's profitable for exchanges. It's also enabling financial ruin.
Industry leaders should coordinate on maximum leverage standards - perhaps 20-50x maximum, with graduated access based on account size and experience.
Action item: CEOs of major exchanges should have serious conversations about self-regulation before regulators impose restrictions.
- Circuit Breakers Worth Exploring
Pausing trading during extreme volatility - as traditional exchanges do - could prevent cascades while giving traders time to reassess.
Yes, crypto trades 24/7 and pauses feel antithetical to crypto culture. But losing $19 billion in eight hours feels worse.
Action item: Develop industry standards for emergency pauses. Define clear, objective criteria. Communicate transparently with users.
- Insurance Fund Transparency is Critical
Binance deployed $188 million from its insurance fund during the crash. How much is left? Is it adequate for future stress?
Users deserve transparency about the safety net that supposedly protects them from exchange losses.
Action item: Publish real-time insurance fund balances. Audit regularly. Be transparent about depletion and replenishment.
- Oracle Redundancy is Essential
Chainlink's flawless performance during the crash validated decentralized oracle architecture. But dependence on a single oracle provider creates risks.
Protocols should implement multi-oracle systems with automatic fallbacks.
Action item: Evaluate oracle diversity. Implement redundancy. Test failover mechanisms.
- Cross-Margin Risks Need Better Communication
The depegging events on Binance (USDE to $0.65, BNSOL to $34.9) were cross-margin liquidation artifacts, not actual asset collapses. But users panicked because they didn't understand what was happening.
Better education about cross-margin risks and clearer communication during events is critical.
Action item: Improve user education about margin types. Provide clear warnings about cross-margin liquidation risks.
The Bottom Line: What October 10-11 Taught Us
The $19 billion crypto bloodbath of October 10-11, 2025 will be studied for years. It was the largest liquidation event in cryptocurrency history - 10 to 20 times larger than any previous crash. It wiped out 1.6 million trader accounts in eight hours. It erased $220 billion in market capitalization before most people had finished dinner.
But here's what's remarkable about what didn't happen:
Stablecoins didn't depeg. They held their dollar pegs perfectly, serving as the safe havens they're designed to be.
Major exchanges didn't collapse. Despite unprecedented stress, Binance, Coinbase, Kraken, and others processed billions in forced sales without systemic failures.
DeFi protocols didn't accumulate bad debt. Aave, MakerDAO, and Compound proved that smart contract-based lending can handle extreme stress.
Oracle systems didn't fail. Chainlink provided accurate price feeds throughout the chaos.
Traditional finance saw no contagion. The crypto crash stayed in crypto. No major banks fell. No pension funds required bailouts.
Regulators didn't panic. The silence from SEC, CFTC, and Treasury suggests they view this as markets working (albeit brutally) rather than market failure.
What the crash exposed:
Leverage levels remain absurdly, dangerously high. Exchanges offering 100-200x leverage are enabling financial ruin. Funding rates above 8% were flashing red warning lights that everyone ignored.
Weekend liquidity is fragile. Friday evening crashes into illiquid weekend trading create perfect conditions for cascades. When ETF markets are closed and institutions can't support prices, volatility becomes extreme.
Cross-margin creates contagion. When a Bitcoin position triggers liquidation of your entire portfolio across multiple assets, crashes spread faster and hit harder.
Crypto has become a macro asset. The days of crypto trading independently of traditional markets are gone. When trade war fears hit, crypto crashes alongside tech stocks. Bitcoin isn't a safe haven - it's a risk amplifier.
What the crash validated:
Crypto infrastructure has matured dramatically. The industry absorbed a shock that would have been existential just a few years ago. The plumbing works.
Regulatory clarity helps. The GENIUS Act's stablecoin framework contributed to USDT and USDC stability. Clear rules support market functioning during stress.
DeFi is real. Smart contract-based protocols proved they can handle extreme volatility without human intervention or protocol failures. Automated liquidations worked.
Institutional adoption provides support structure. Bitcoin ETFs holding ~$100 billion in assets create a capital base that should support eventual recovery, even if short-term flows are negative.
What happens next:
The most likely scenario is a gradual recovery over 4-8 weeks. Bitcoin consolidates in the $95,000-$115,000 range, tests support a few times, slowly builds a base, then eventually breaks higher in late November or December.
This isn't the bull market top. This is a violent, leverage-driven correction triggered by external macro factors. The fundamental bull thesis - institutional adoption, regulatory clarity, ETF products, sovereign adoption - remains intact.
But it's a brutal reminder that leverage kills, macro matters, and markets can stay irrational longer than you can stay solvent.
For the 1.6 million traders who got liquidation notices on October 10, the lesson is expensive and painful: trade with less leverage, manage risk seriously, and never bet more than you can afford to lose.
For the crypto industry, it's a stress test passed with bruises but no broken bones. The infrastructure held. The recovery can begin.
For the rest of us watching, it's a reminder that crypto markets remain wild, dangerous, and absolutely fascinating - capable of enormous gains and catastrophic losses, sometimes within the same week.
The $19 billion question now: what happens Monday morning when institutional money decides whether to panic or double down?
The answer will determine whether October 10-11, 2025 was the bottom of a correction or the beginning of something worse.
Watch the ETF flows. Watch the exchange reserves. Watch the funding rates. And maybe - just maybe - consider trading with a little less leverage next time.