


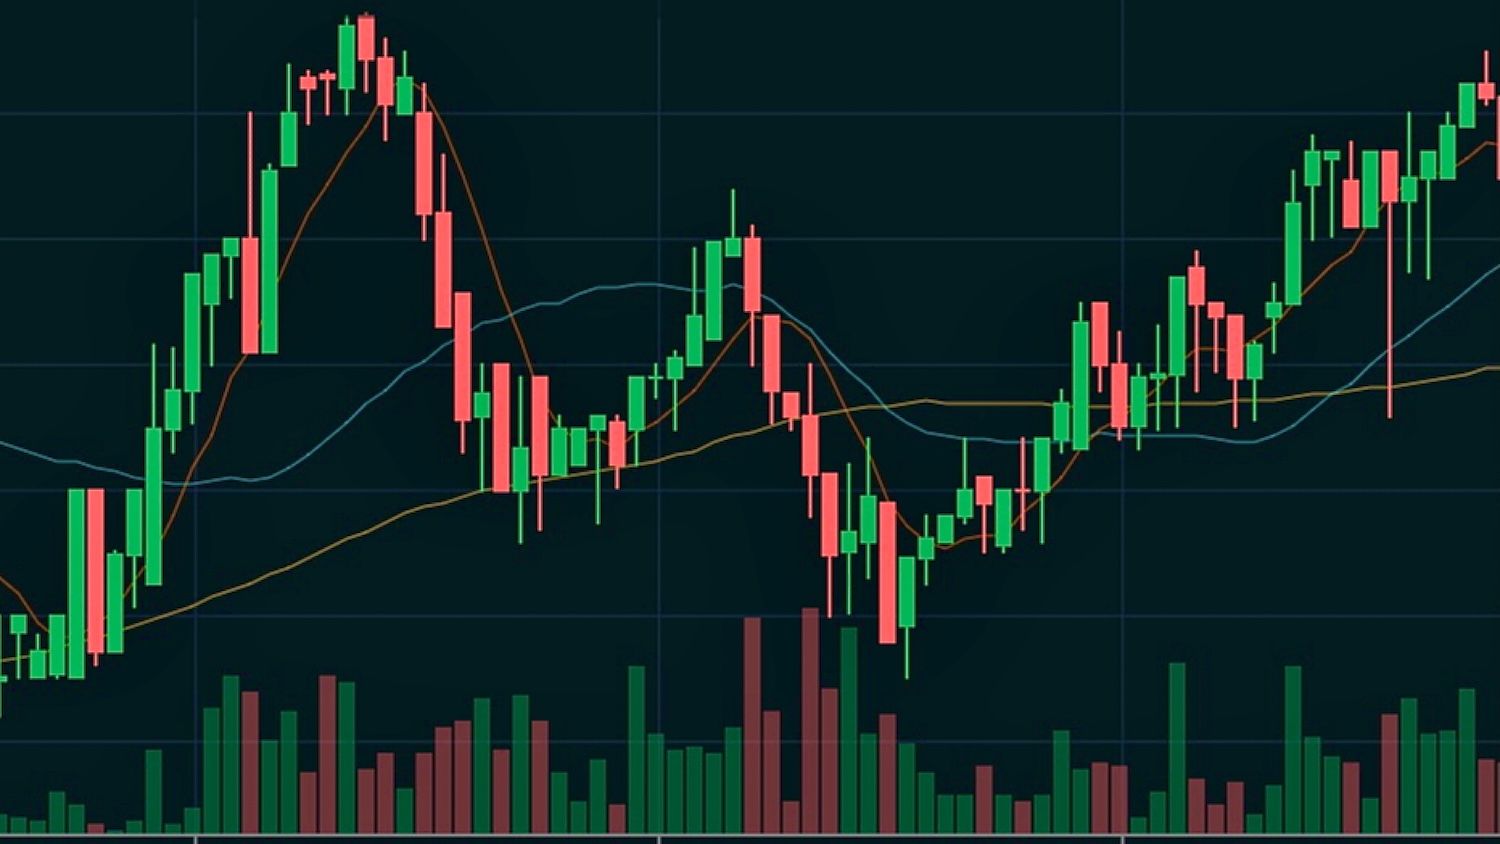
Solana has broken through a critical resistance level at $205 after posting a 20.89% weekly gain, with technical analysis suggesting the cryptocurrency could reach $362 in the mid-term. Market expert Ali Martinez identified the breakout from an ascending triangle formation as a bullish continuation pattern that projects significant upside potential for the fifth-largest cryptocurrency by market capitalization.
What to Know:
- Solana surged 20.89% over the past week and now trades at $246, sitting just 18.05% below its all-time high of $294
- Technical analysis shows SOL broke above key $205 resistance after months of consolidation, forming a bullish ascending triangle pattern
- Fibonacci extension levels point to potential targets at $250, $277, $321, and ultimately $362 if momentum continues
Technical Breakout Signals Bullish Momentum
The recent price movement represents more than a simple rally. SOL's surge above the $205 level marked the end of a prolonged consolidation period that lasted from April through August. This breakout, combined with the formation of consistently higher lows, created what technical analysts recognize as an ascending triangle pattern.
Martinez's analysis on social media platform X highlighted the significance of this technical development.
The pattern typically indicates strong underlying demand and often precedes substantial price advances. Trading volume supporting the breakout adds credibility to the bullish thesis, though recent 24-hour volume has declined 27.53% to $7.49 billion.
The Fibonacci extension methodology provides specific price targets for the ongoing rally. The immediate objective sits at the 1.272 extension level around $250. Should buying pressure persist, the next targets emerge at $277 (1.414 extension) and $321 (1.618 extension). The ultimate mid-term goal reaches $362, corresponding to the 1.786 Fibonacci extension.
Market Dynamics and Risk Assessment
Current market conditions present both opportunities and challenges for Solana's continued advance. The cryptocurrency trades at $246 as of the latest data, reflecting modest 24-hour gains of 1.67%. Despite the reduced trading volume, the asset maintains its position as the world's fifth-largest cryptocurrency with a market capitalization of $131.65 billion.
Downside risks remain present despite the bullish technical setup.
The $205 level now functions as crucial support, and any decisive break below this threshold could trigger a retest of lower Fibonacci retracement zones. Potential support levels include $176 and $156, though the ascending trendline from April provides additional structural support.
Analyst sentiment reflects cautious optimism about Solana's prospects. Coincodex projects limited near-term movement with the asset expected to trade around $247 over the next month.
Their three-month outlook suggests a climb to $264, indicating steady but measured growth expectations. The Greed & Fear Index currently sits at a neutral 52, suggesting balanced market sentiment rather than excessive speculation.
Understanding Key Technical Indicators
Fibonacci extensions represent a technical analysis tool used to identify potential price targets beyond previous highs. These levels are calculated by extending key Fibonacci ratios (such as 1.272, 1.414, 1.618, and 1.786) from significant price swings. Traders often use these projections to establish profit-taking levels or assess the potential scope of trending moves.
Ascending triangles form when an asset creates a series of higher lows while encountering resistance at a consistent horizontal level.
The pattern suggests accumulation by buyers at progressively higher prices, building pressure that often results in an upward breakout. The measured move target typically equals the height of the triangle's widest point projected from the breakout level. Market capitalization represents the total value of a cryptocurrency, calculated by multiplying the current price by the circulating supply. Solana's $131.65 billion market cap reflects its significant presence in the digital asset ecosystem and influences its ranking among cryptocurrencies.
Closing Thoughts
Solana's breakout above $205 resistance establishes a foundation for potential gains toward the $362 target, supported by technical patterns and Fibonacci projections. The cryptocurrency's position near all-time highs, combined with its substantial market capitalization, underscores its significance in the current market cycle. While near-term projections suggest modest gains, the technical setup supports the possibility of more substantial advances if buying momentum continues.