


Bitcoin (BTC) has spent much of early 2026 trapped between $60,000 and $75,000, briefly touching $75,800 on Mar. 16 before settling back to $74,400 on Mar. 17, unable to sustain a breakout despite a record number of whale wallets accumulating coins and unable to collapse despite macroeconomic conditions that have gutted investor confidence across every risk asset class.
It raises a question that now dominates every trading desk and crypto forum on the planet: why won't this market move?
The State of the Crypto Market in March 2026
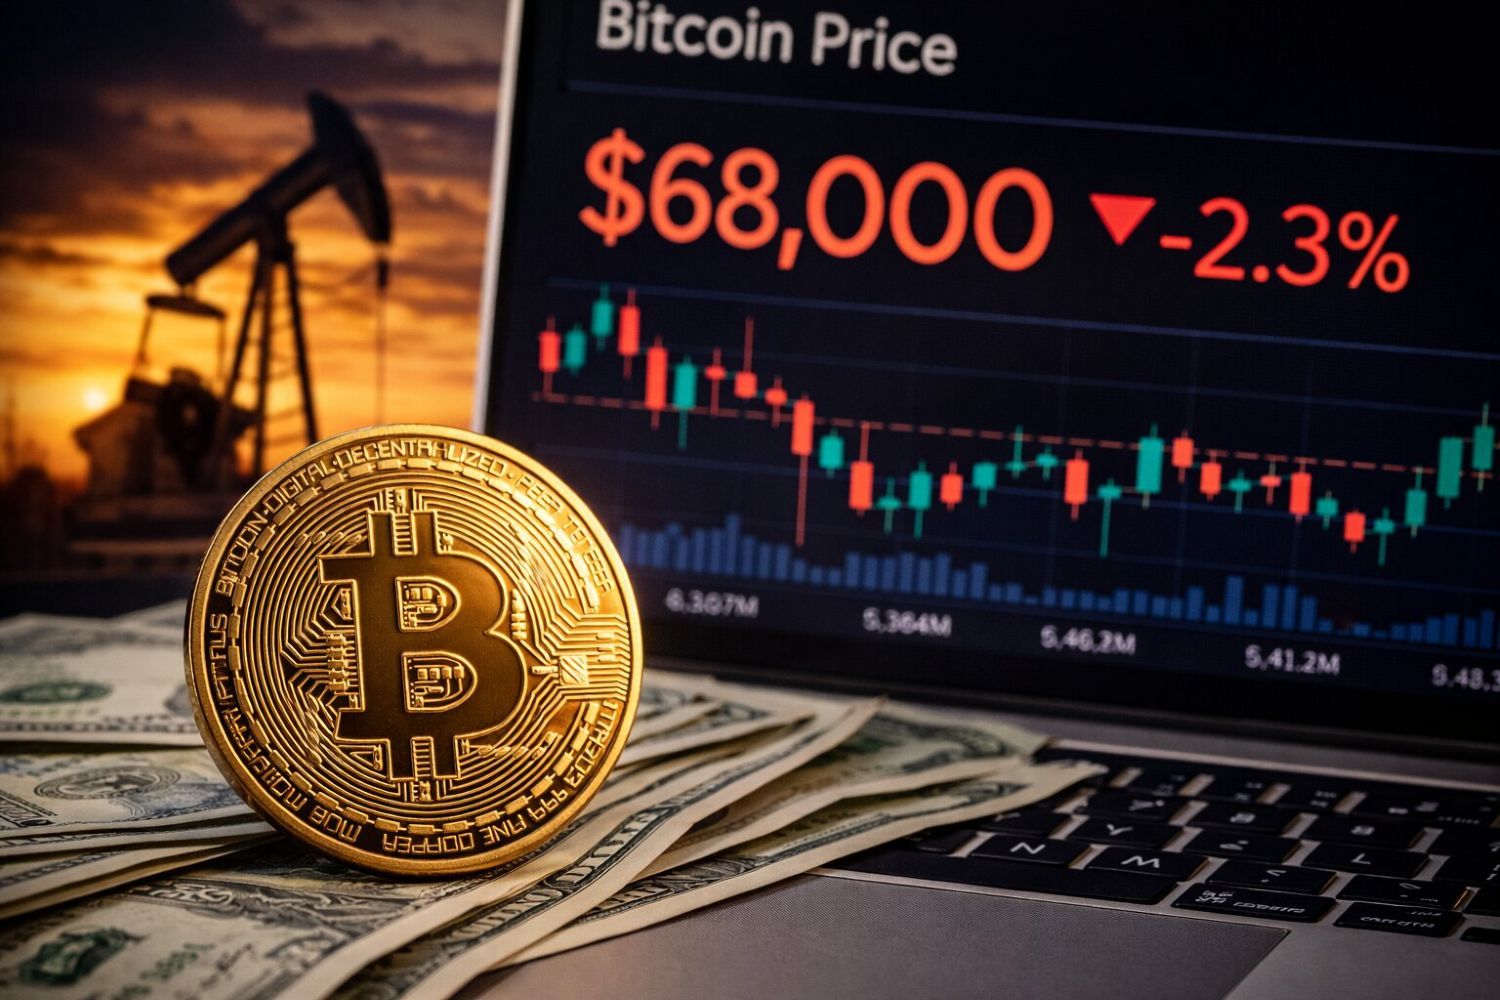
As of Mar. 17, Bitcoin traded at roughly $74,400, having surged nearly 25% from its February bottom of $60,000 as easing fears over the Strait of Hormuz closure pushed oil prices lower and lifted risk appetite. That number still sits about 41% below the all-time high of $126,210 recorded on Oct. 6, 2025, a peak that now feels like ancient history.
The total cryptocurrency market capitalization hovered near $2.45 trillion. Bitcoin dominance held between 57% and 59%, a range that has persisted since December and reflects capital hiding in BTC rather than rotating into smaller tokens.
Ether (ETH) reclaimed $2,300 on the back of the broader rally. Solana (SOL) climbed to roughly $95 after weeks stuck in the mid-$80s, and XRP (XRP) was trading around $1.58 after its own sharp bounce.
The Crypto Fear & Greed Index fell to a record low of 5 on Feb. 6 and has remained in Extreme Fear territory for approximately 34 consecutive days. Two overlapping crises drove the collapse in sentiment.
First, President Donald Trump signed a 10% global tariff on all imports on Feb. 23, which triggered an immediate 5% drop in Bitcoin and rattled every correlated risk market. Then a joint U.S.-Israeli military operation against Iran began on Feb. 28, sending oil above $100 a barrel and forcing a rapid reassessment of global risk appetite that spilled directly into crypto liquidations totaling more than $300 million in a single weekend.
Also Read: BlackRock Launches Staked ETH Fund On Nasdaq
1. The Fed Won't Commit to Rate Cuts
The Federal Reserve held rates at 3.50% to 3.75% in its most recent decision, and the December 2025 dot plot showed deep internal division, with equal numbers of policymakers projecting zero, one, or two cuts for 2026.
CME FedWatch data showed just 2.4% probability for a March cut. JPMorgan went further, predicting the next move will actually be a rate hike in Q3 2027.
February's Consumer Price Index came in at 3.1% year-over-year, above consensus of 2.9%. Oil surging above $100 because of the Strait of Hormuz crisis keeps inflation expectations elevated and makes the case for monetary easing harder to justify.
Deutsche Bank analyst Marion Laboure identified hawkish Fed signals, institutional outflows, thinning liquidity, and stalled regulatory momentum as three overlapping drivers of bearish pressure. Without a clear path to lower rates, risk assets like Bitcoin remain stuck in a holding pattern.
Also Read: Bank of England May Scrap £20K Stablecoin Holding Limit
2. Bitcoin ETF Outflows Hit Record Levels
U.S. spot Bitcoin ETFs recorded roughly $6.18 billion in net outflows from November 2025 through January 2026, the longest sustained outflow streak since the products launched in January 2024. The worst single day was Jan. 29, when $817.9 million fled across all funds in a single session.
February alone saw approximately $3.8 billion exit, making it the worst single month on record for spot Bitcoin ETFs. March has brought a more convincing reversal with roughly $1.3 billion in net inflows through mid-month, potentially marking the first positive month for flows since October, but the pace still falls short of what would be needed to offset prior damage.
Vikram Subburaj, CEO of Giottus, told CoinDesk that ETF flows paint a tactical picture, with periods of inflows followed by modest outflows, indicating rotation rather than conviction buying. Meanwhile, gold ETFs absorbed $16 billion over three months, representing a direct headwind for the digital gold narrative that helped propel Bitcoin to six figures in 2025.
Also Read: Democrats Vow Oversight Of DOJ Binance Probe
3. Institutional Buyers Have Run Out of Steam
Strategy, formerly known as MicroStrategy, holds 714,644 BTC at an average cost of roughly $76,056 per coin, which means the company remains underwater by roughly $1.2 billion even after the latest rally to $74,400. Strategy accounts for 97.5% of net new corporate Bitcoin purchases as of January 2026.
Standard Chartered cut its 2026 Bitcoin forecast from $300,000 to $150,000, citing what it described as the end of Digital Asset Treasury buying as a structural support mechanism. Geoff Kendrick, the bank's global head of digital asset research, said valuations no longer support further Bitcoin DAT expansion and that consolidation rather than outright selling should be expected.
Ki Young Ju, CEO of CryptoQuant, put the math in blunt terms: in 2024, $10 billion in cash could create $26 billion in BTC book value, but in 2025, $308 billion flowed in yet the market cap fell $98 billion. Selling pressure, he argued, has grown too heavy for any multiplier effect to take hold.
Also Read: XRP Clears Bearish Trend Line, Eyes $1.420
4. Mining Economics Are Squeezing the Industry
JPMorgan estimates the industry average Bitcoin production cost has fallen to $77,000 from $90,000 at the start of the year. That still exceeds Bitcoin's current market price of $74,400, meaning many operators continue to mine at a loss even after the recent rally.
MARA Holdings, which holds 53,822 BTC, revised its treasury policy in March 2026 to allow Bitcoin sales for the first time.
Core Scientific has announced plans to sell most of its BTC holdings over the course of the year, adding another source of potential selling pressure.
The April 2024 halving reduced block rewards to 3.125 BTC per block, and the historical four-year cycle pattern is playing out on schedule.
Bitcoin peaked roughly 18 months after the halving, matching previous cycles precisely. One investment firm told CoinDesk that Bitcoin is now in deep bear market territory, and the four-year cycle momentum is extremely difficult to break because of individual investors' psychological behaviors.
Also Read: Can Bitcoin Break $72K To Ignite Rally?
5. The CLARITY Act Is Stuck in the Senate
The CLARITY Act passed the House on July 17, 2025, with a 294-to-134 vote, but the Senate Banking Committee postponed its markup on Jan. 14, 2026, after the industry withdrew support over stablecoin yield provisions. The American Bankers Association formally rejected a White House compromise on Mar. 5.
The U.S.-Iran conflict is consuming Congressional attention and pushing crypto legislation further down the calendar. Prediction markets still price passage odds at 72% for 2026, but the delay removes what was expected to be one of the year's biggest catalysts for institutional capital to enter the market.
Nikolaos Panigirtzoglou of JPMorgan wrote that a potential approval of market structure legislation, most likely by midyear, could serve as a positive catalyst for crypto markets in the second half. Until that happens, sidelined institutional capital from pension funds and corporate treasuries remains on the sidelines.
Also Read: Prosecutors Urge Court To Reject Sam Bankman-Fried's New Trial Request

6. Whales Are Accumulating and Distributing at the Same Time
A record 20,031 whale wallets now hold 100 or more BTC as of Mar. 13, an all-time high. Whales added an estimated 56,227 BTC to their balances since December 2025, and on Feb. 6 alone, 66,940 BTC moved into accumulation wallets.
Yet the picture is not as simple as big money betting on a rebound.
The All Exchanges Whale Ratio surged to a 10-month high, indicating that whales are simultaneously using exchanges to potentially exit into rallies. Spot trading volume fell to its lowest level since November 2023, according to Glassnode, creating fragile liquidity conditions where any large order can whipsaw the price.
CryptoOnchain, a CryptoQuant analyst, wrote that the pattern suggests a potential strategy by whales to capitalize on buy-side liquidity and use the current market as exit liquidity. The MVRV Z-Score sits in the 1.2 zone, and the Spent Output Profit Ratio has dipped below 1.0, meaning the average coin being sold is sold at a loss.
Also Read: When Clicking Through Warnings Cost $50M In The Worst AAVE Trade Ever Recorded
7. Technical Resistance at $70,000 Blocks Every Rally
Bitcoin rejected at the $70,000-to-$72,000 resistance zone on Mar. 3, Mar. 10, and Mar. 12 before finally surging through $74,000 over the weekend on easing geopolitical fears and short-covering. The 50-day simple moving average still sits at roughly $76,862, and the 200-day SMA rests near $96,601, both above the current price, signaling that the broader trend remains broken despite the recent bounce.
The relative strength index hovers between 44 and 45, which is neutral territory with no directional bias. MACD convergence near zero suggests flattening momentum.
Alex Kuptsikevich, chief market analyst at FXPro, told CoinDesk that the 50-day moving average has proved a formidable resistance level, preventing bulls from swiftly turning the tide in their favor. He noted that a confident break above it would serve as an important turning point for the medium-term trend.
The consolidation range remains defined by $65,000 support and $73,300 resistance, where the 20 exponential moving average currently rests.
Also Read: JPMorgan Sued Over Alleged $328M Crypto Liquidity Pool Fraud
8. No Altcoin Season Means No Fresh Capital
The CMC Altcoin Season Index sits at 34 out of 100, firmly in what the industry calls Bitcoin Season territory. Altcoin season begins above 75. TOTAL2, which measures the crypto market capitalization excluding Bitcoin, has fallen 32% from its all-time high of $1.77 trillion to $1.19 trillion.
Only about 8% of altcoins trade above their 50-day moving average. Without a broad-based altcoin rally to generate retail excitement and fresh capital inflows, the crypto ecosystem lacks the speculative energy that historically propels Bitcoin past key resistance levels.
Bernstein analyst Gautam Chhugani confirmed what he called an elongated bull cycle and suggested that altcoin rotation is starting. But it starts from extremely depressed levels, with Bitcoin dominance having peaked at 61% on Feb. 24 before pulling back slightly. Ether's share of the total market has shrunk to around 10%, a level not seen in years.
Also Read: CFTC Signals New Regulatory Push As Prediction Markets Surge In Popularity
9. Geopolitical Shocks Keep Risk Appetite Suppressed
The joint U.S.-Israeli military operation against Iran that launched on Feb. 28 represents the most significant geopolitical shock to markets since Russia's 2022 invasion of Ukraine. Brent crude surged above $100 a barrel, and West Texas Intermediate hit roughly $108, a four-year high.
Bitcoin fell below $66,000 during peak conflict fears. The Supreme Court struck down emergency IEEPA tariffs, but more than $133 billion remains at stake in tariff refund litigation, adding another layer of policy uncertainty.
Jake Ostrovskis, head of OTC at Wintermute, argued that the oil move matters more for crypto than the geopolitics itself. James Butterfill of CoinShares explained that unlike gold, Bitcoin has a growth component, meaning it reacts to economic trends and liquidity cycles, making tariffs a net negative in the short term.
Also Read: Bitcoin Stuck Below $70K For A Month As Short Sellers Pile In And New Buyers Bleed Losses
10. Extreme Fear and Leverage Exhaustion Have Frozen the Market
The Fear & Greed Index has spent roughly 34 consecutive days in Extreme Fear, hitting that all-time low of 5 on Feb. 6. BTC perpetual funding rates turned negative, ranging from -0.0078% to -0.0095%, indicating short-bias dominance.
On Mar. 12 alone, $387 million in crypto futures were liquidated, with 72.4% of them being long positions. Yet open interest remains elevated at $5.7 billion on Binance alone, and retail traders remain disproportionately long on assets like Solana at 74.6%, creating a divergence with bearish institutional positioning.
Ali Daylami, head of data analytics at BITmarkets, told The Currency Analytics that the market is no longer seeing massive crashes or wild swings, just a grinding sideways movement that is wearing everyone down. Markus Thielen, head of research at 10x Research, noted that Bitcoin's latest drops were driven less by a single headline and more by weak liquidity conditions that leave the market unable to sustain any directional move.
Also Read: Crypto Firms Challenge Banking Sector On Stablecoin Reward Restrictions
Conclusion
The 10 factors listed above converge to create a market caught between a floor around $60,000 to $65,000, supported by whale accumulation, mining cost floors, and institutional holders' cost bases, and a ceiling that has shifted slightly higher to the $75,000-to-$77,000 zone, where the 50-day moving average, persistent miner selling, stalled regulation, and macro headwinds continue to cap sustained advances. The rally to $74,400 cracked through prior resistance at $72,000, but has yet to prove it can hold above the next wall at $75,000.
Three catalysts could extend the breakout. A dovish signal from the Fed, whose next decision falls on Mar. 18 to 19, would loosen financial conditions. Passage of the CLARITY Act, which prediction markets still give 72% odds in 2026, would open the gates for sidelined institutional capital. And activation of purchasing for the U.S. Strategic Bitcoin Reserve, which currently holds more than 335,000 BTC, could signal sovereign-level demand.
Fabian Dori, chief investment officer at Sygnum Bank, perhaps summed up the situation best when he told CoinDesk there is not one single cause, indicator, or driver behind this gap, calling it a number of elements that have been building over recent months. Until at least one of those elements breaks in a definitive direction, Bitcoin appears content to sit right where it is.
Read Next: Elizabeth Warren's Bitcoin Bailout Warning Exposes A Trump Family Conflict Of Interest