


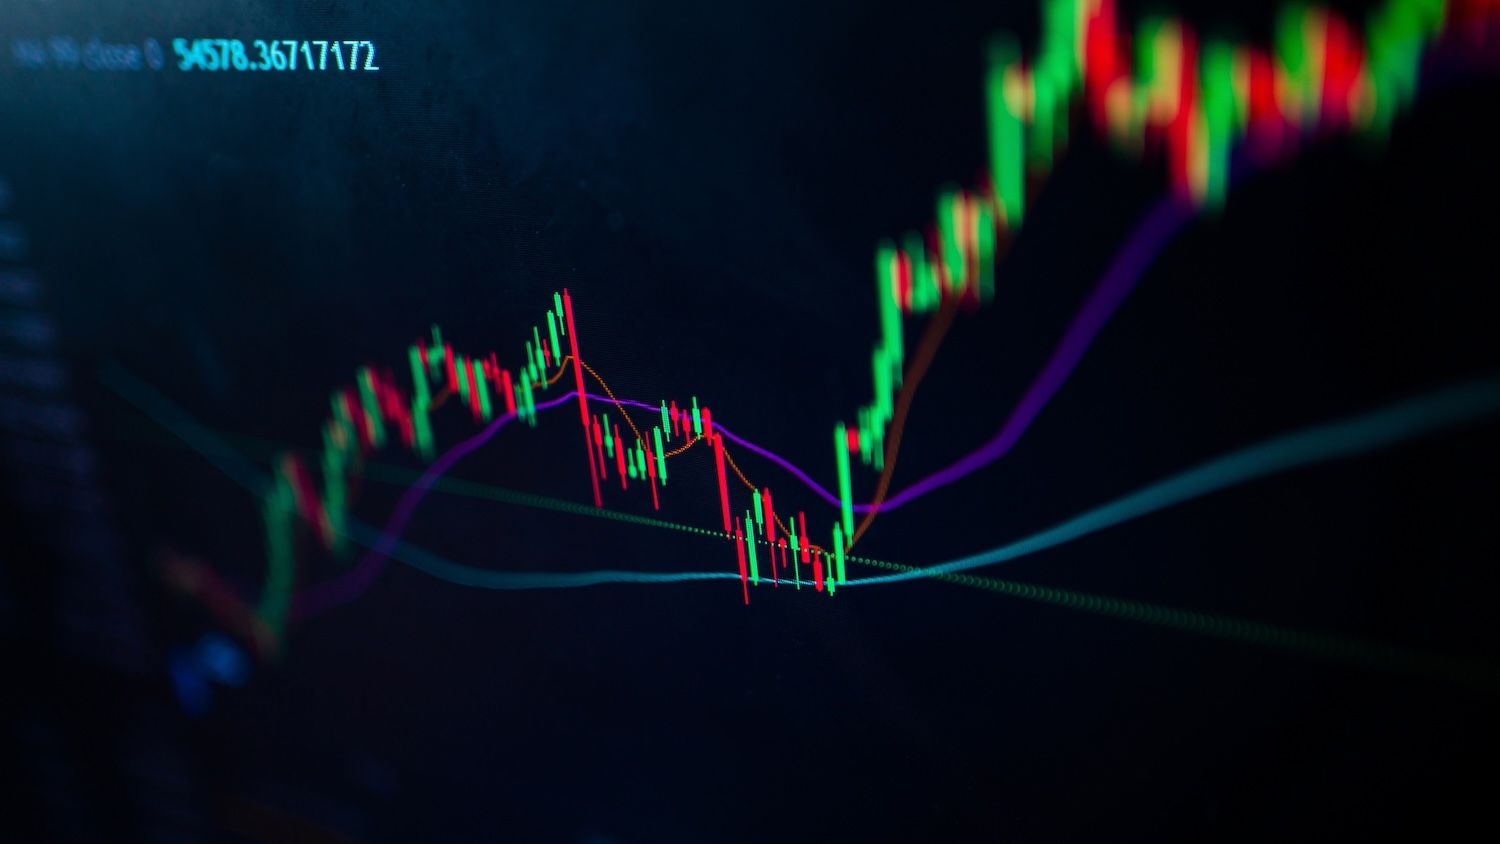
Bitcoin reached a new all-time high near $123,973 during Thursday's trading session, marking another milestone in the cryptocurrency's ongoing bull run as technical indicators suggest potential for further upward movement toward the $125,000 resistance level.
What to Know:
- Bitcoin established a fresh all-time high at $123,973 after gaining momentum above the $122,000 threshold, with bulls now targeting the $124,000-$125,000 resistance zone
- Technical analysis shows the cryptocurrency trading above key support levels including the $120,200 trend line and 100-hour simple moving average, indicating continued bullish sentiment
- Downside protection appears limited with major support levels identified at $122,750 and $121,500, though a break below could lead to a test of the $118,500 zone
Market Momentum Drives New Records
The world's largest cryptocurrency by market capitalization established its foundation above $118,500 before launching into fresh territory. Bitcoin gained significant traction as it moved beyond the $120,000 and $120,500 levels. Market participants pushed the digital asset through the $122,000 barrier.
The breakthrough led to a new record high near $123,973. Trading data from Kraken exchange shows Bitcoin currently consolidating gains above the 23.6% Fibonacci retracement level of the upward movement from the $118,971 swing low to the $123,973 peak.
Current price action keeps Bitcoin positioned above both the $120,000 psychological level and the 100-hour simple moving average. A bullish trend line has formed with support anchored at $120,200 on the hourly chart for the BTC/USD trading pair.
Resistance Levels and Price Targets
Immediate resistance confronts Bitcoin near the $124,000 level. The first significant barrier sits around $124,500, followed by the $125,000 threshold. A decisive close above $125,000 could trigger additional upward momentum.
Such a breakthrough might propel Bitcoin toward the $126,250 resistance zone. Further gains could target the $127,000 level. Market analysts identify $128,000 as the primary upside objective.
Technical indicators support the bullish outlook.
The hourly MACD indicator shows accelerating momentum within the bullish zone. The Relative Strength Index for BTC/USD maintains positioning above the neutral 50 level.
Understanding Key Market Terms
Several technical concepts shape Bitcoin's current price analysis. The Fibonacci retracement tool helps traders identify potential support and resistance levels based on previous price movements. Moving averages smooth out price data to identify trend direction over specific time periods.
MACD measures the relationship between two moving averages of a security's price. RSI evaluates the speed and magnitude of price changes to determine overbought or oversold conditions. Support and resistance levels represent price points where buying or selling pressure typically emerges.
These indicators collectively provide market participants with analytical frameworks for making trading decisions.
Support Structure Analysis
Should Bitcoin fail to breach the $124,000 resistance zone, corrective action remains possible. Initial downside support appears near $122,750. The first major support level sits around $121,500, coinciding with the 50% Fibonacci retracement of the move from $118,971 to $123,973.
Additional support emerges near the $120,200 zone, aligned with the established trend line. Further declines might test the $118,500 support area in the near term.
The main support foundation rests at $117,500. A break below this level could trigger continued downward movement. However, current market structure suggests limited downside potential given the strength of recent price action.
Major support levels include $122,750 and $120,200. Primary resistance zones encompass $124,000 and $125,000.
Closing Thoughts
Bitcoin's achievement of a new all-time high near $123,973 demonstrates continued institutional and retail interest in the cryptocurrency market. Technical indicators suggest the potential for additional gains toward the $128,000 target, though key resistance levels at $124,000 and $125,000 must first be overcome for sustained upward movement.