
Bitcoin (BTC) has reached the correction zone identified in the previous analysis, but its next move is still taking shape. Trading volume is low and momentum is lacking. Even so, the main scenario remains bullish, with the focus on whether this pause allows a bottom to form before another attempt to reclaim resistance levels.
A correction that keeps the bullish scenario intact
The bearish divergence that appeared near $87,000 pointed to a cooling in price momentum. Following the pullback toward $80,000, the RSI has cooled and Bitcoin is once again approaching the moving average used here as a reference.
This behavior resembles an earlier correction, when the price found support in that area before resuming its advance. The similarity does not guarantee a repeat, but it is one of the reasons the outlook remains positive.
For now, there is no confirmed breakdown below the reference moving averages on either the daily or weekly chart. The $80,000–$82,000 zone remains critical, although a firm reclaim of $82,000 is needed to strengthen the case for support.
Bitcoin daily chart
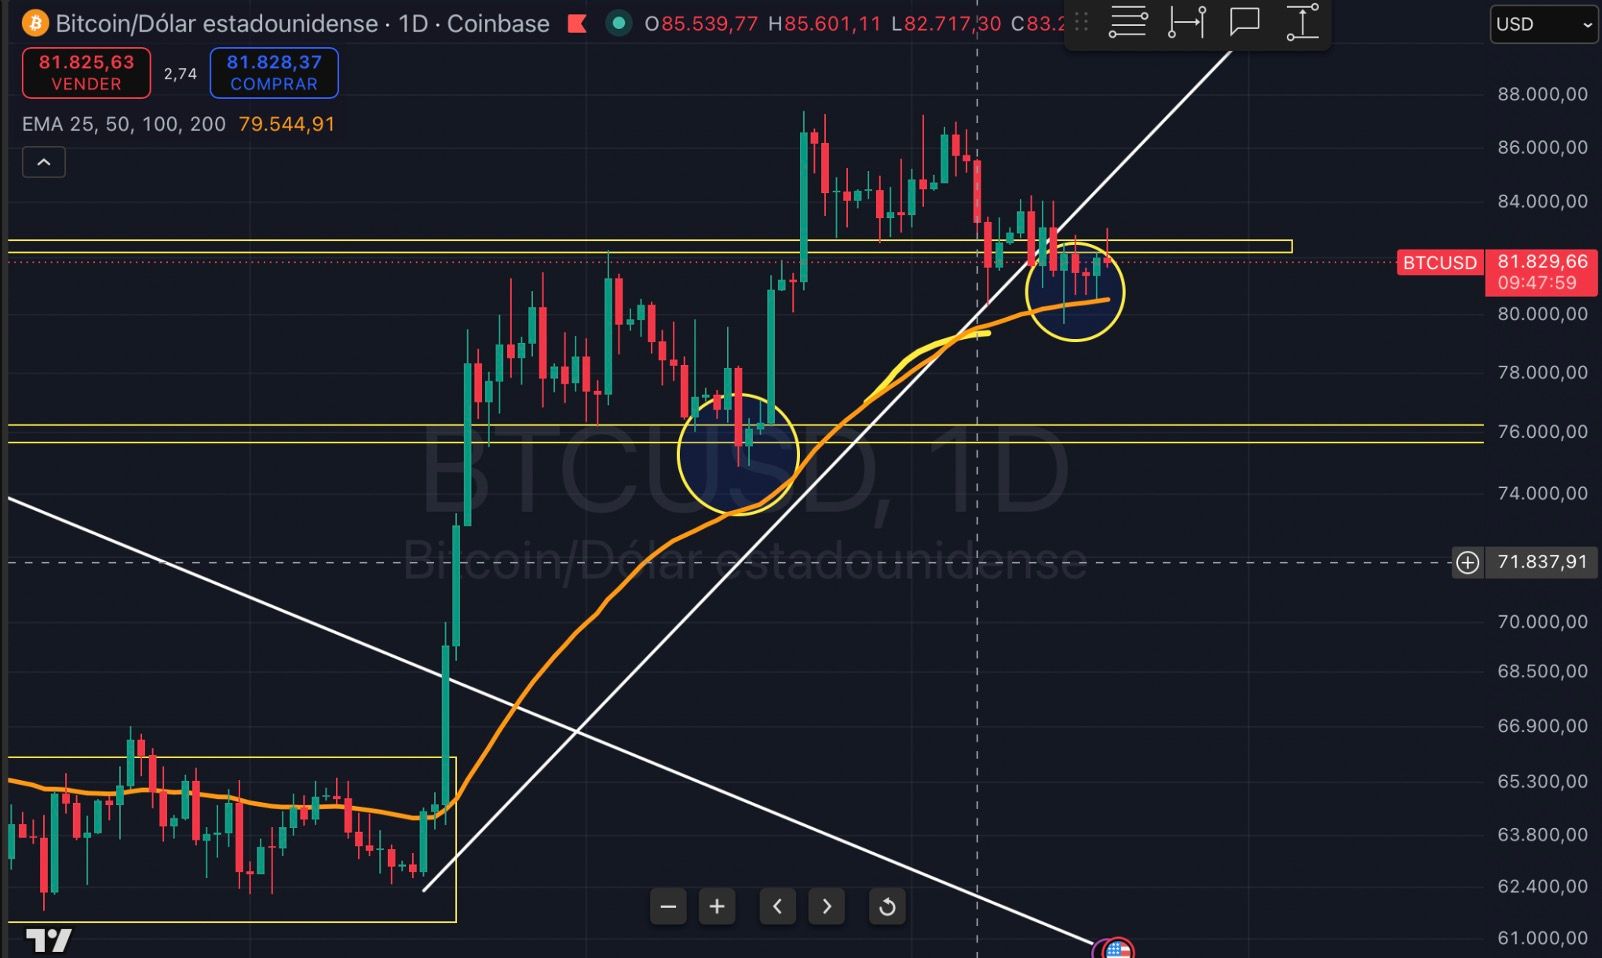
BTC/USD daily chart showing the current test of the moving average and the earlier correction. Source: TradingView; chart provided by CryptoCedric.
Bitcoin weekly chart
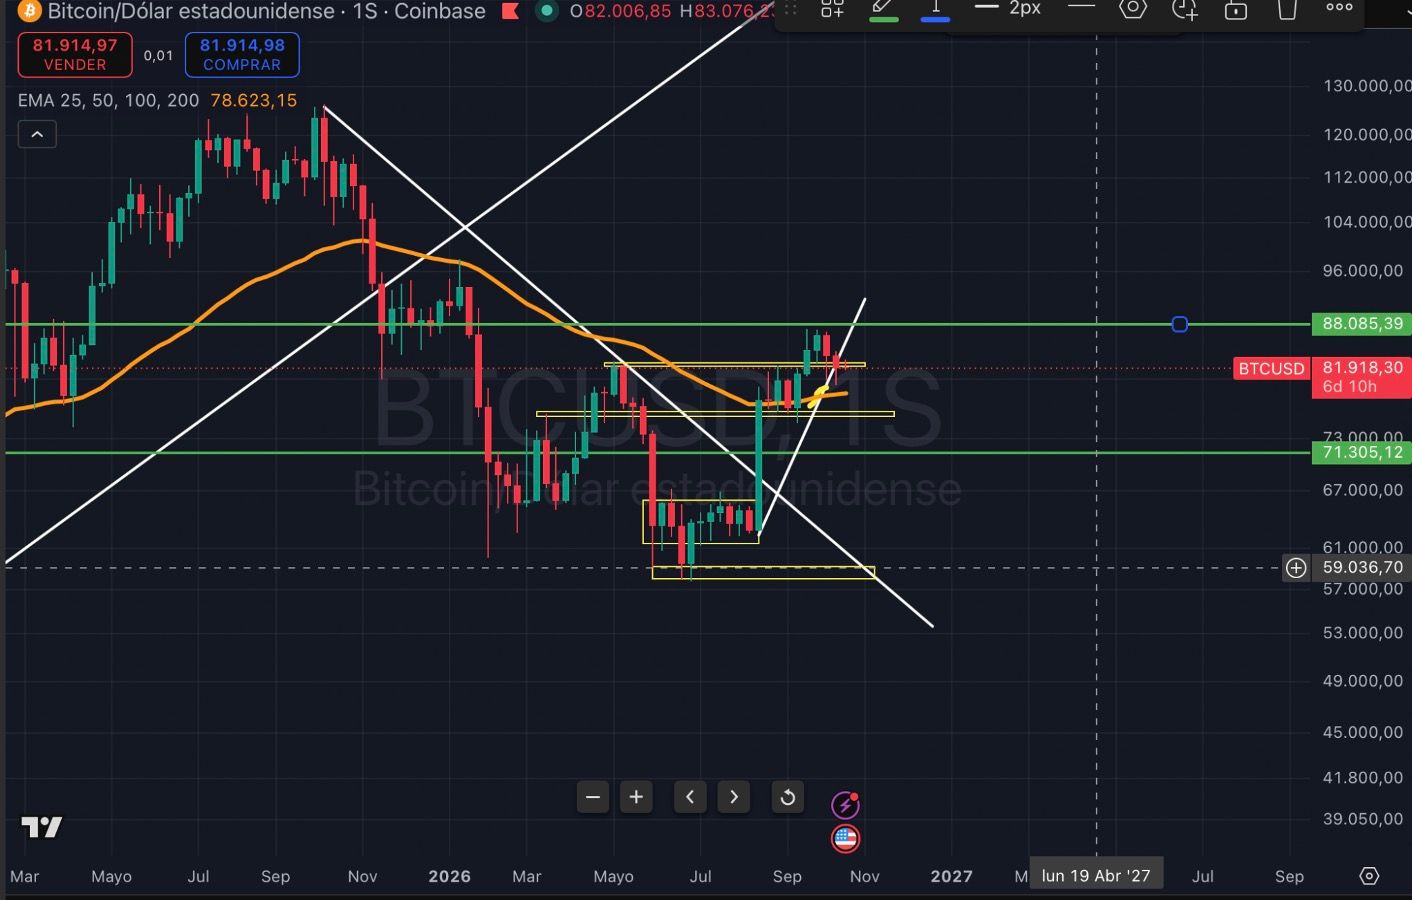
BTC/USD weekly chart showing the reference moving average and key price levels. Source: TradingView; chart provided by CryptoCedric.
Also Read: No Preorder, No iPhone Duo? Apple Reportedly Braces Its Stores For Oct. 23
ETFs are not yet providing sustained buying momentum
Since the last analysis, ETF flows have alternated between inflows and outflows. According to the accompanying table, net inflows reached $175.7 million on October 13, followed by $261.4 million in outflows on October 14. The following two sessions saw more modest flows.
The interpretation here is that consistent institutional demand is still missing to support a breakout. This fits with a market still waiting for a catalyst, although ETF flows and trading volume are different indicators.
Bitcoin ETF net flows
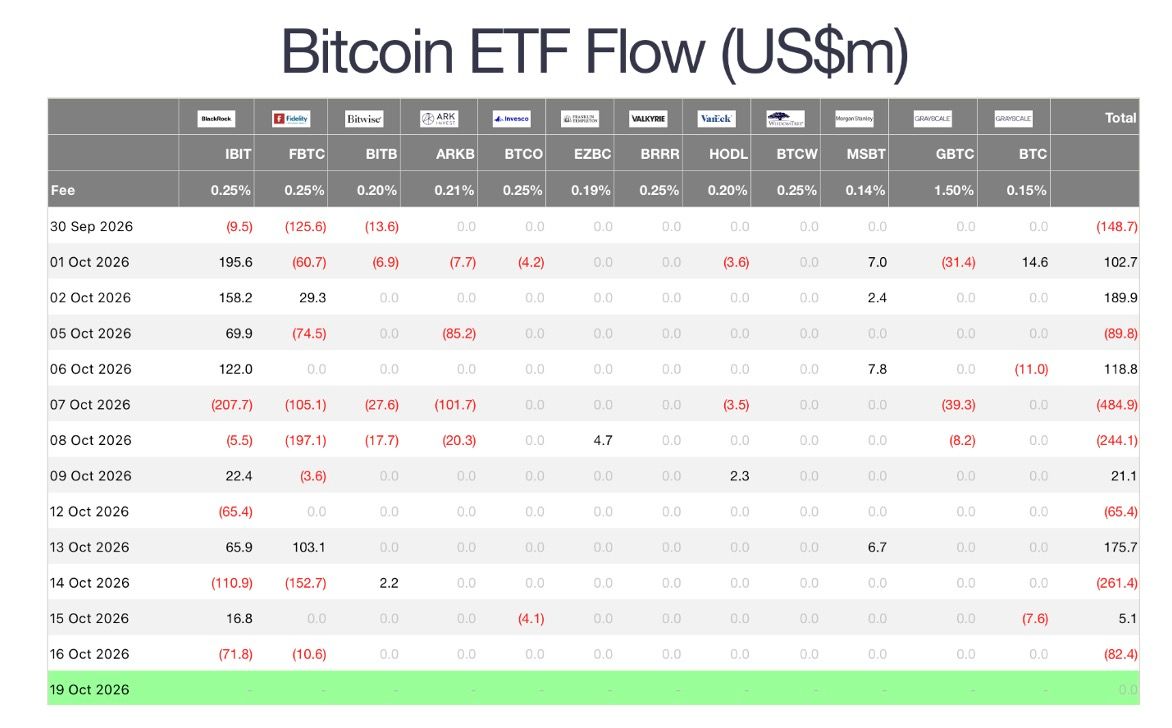
Daily net flows into and out of Bitcoin ETFs, in US$ millions. Source: supplied ETF flow table; completed sessions through October 16, 2026.
What Bitcoin needs to move toward $94,000
The $94,000 target for the bullish scenario is maintained, but Bitcoin first needs to overcome resistance at $85,000 before challenging $87,000 and reclaiming the broader $86,000–$88,000 range.
In that zone, the signal to watch for is buyers absorbing selling pressure and a period of consolidation that turns resistance into support. That would be a more convincing signal than a rapid rally followed by another rejection.
As long as the current support zone holds, a local bottom could be forming. A confirmed loss of that support and of the moving averages under watch would require a reassessment of this interpretation.
A long term perspective on Solana and Ethereum
Altcoins are also under watch. Solana (SOL) was previously bought around $64, with plans now to buy more near $100–$103, with a long-term view.
For Ethereum (ETH), a similar strategy is under consideration, with potential additional purchases around $2,380.
The lack of movement has not changed the main scenario. The focus is now on the defense of support, a reclaim of $82,000 and a break above resistance at $85,000. Only then will attention turn to $87,000 and the broader $86,000–$88,000 range. The market's response there will be the test of whether Bitcoin can take its next step toward $94,000.
Read Next: Is AI's Black Box Cracking? Ex-OpenAI Researcher Says 90% Of Neurons Do One Job