


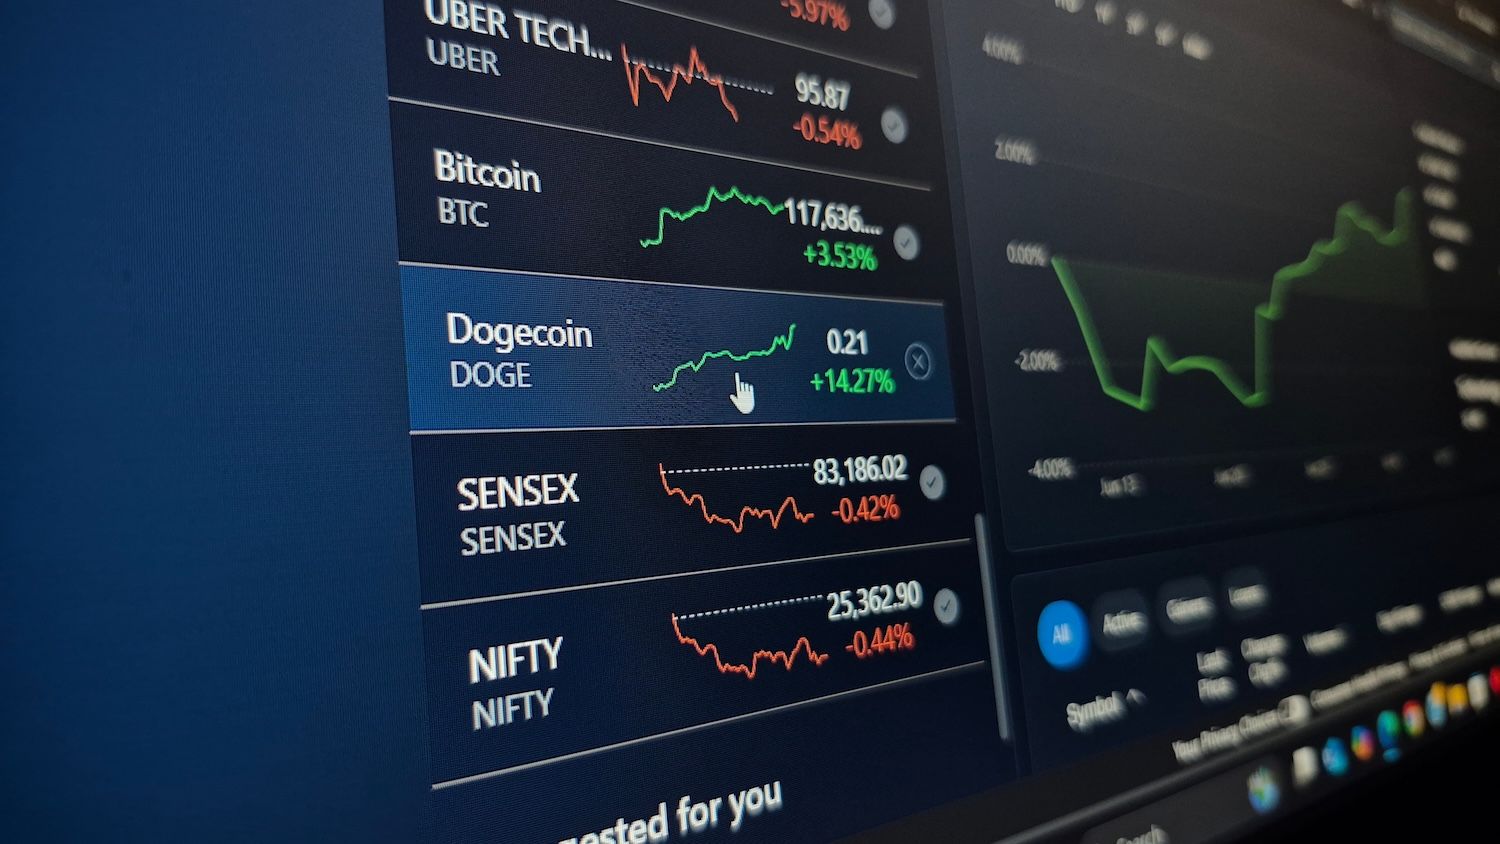
Dogecoin's months-long price decline could reverse sharply as technical patterns and volume dynamics align for a potential breakout, according to crypto analyst Cantonese Cat. In a video analysis published Sunday, the analyst argued that the memecoin's retreat has occurred on diminishing trading activity—a pattern that historically precedes significant price jumps when buying pressure returns, even in modest amounts.
What to Know:
- Dogecoin has broken multiple downtrend lines on declining volume, a setup the analyst views as constructive for an eventual reversal
- The cryptocurrency faces resistance at the 0.618 Fibonacci retracement level and below the weekly Ichimoku cloud indicator
- Bitcoin's recovery above $112,000 and Ethereum breaking through resistance suggest broader market conditions may support altcoin gains
Technical Setup Points to Reversal Potential
Cantonese Cat noted that Dogecoin continues struggling to break above the 0.618 Fibonacci retracement level on higher timeframes while remaining below the weekly Ichimoku cloud. Despite these resistance points, he described the price action as building toward a shift.
"It's basically been breaking trendline after trendline," the analyst said.
Each successive break of a downtrend line has occurred with fading volume—a dynamic he interprets as tilting probabilities toward an upward move. The pattern suggests sellers are losing conviction while buyers have yet to engage in force.
The analyst emphasized that volume remains the critical variable. "All this downtrend was on declining volume. So you know that all it takes is just a little bit of volume to reverse this downtrend," he said. "Whenever this trendline gets broken and some volume kicks in, you just end up going a lot higher."
Cantonese Cat characterized the current phase as an inflection point where incremental demand could prove sufficient to flip momentum and push price through nearby resistance. "You have a downtrend here on low volume and all it takes is just a little bit [of] volume here and this downtrend here can be reversed," he said. "And it certainly looks like it's in the process of doing that right now as we speak."
His analysis rests on multiple technical factors rather than a single catalyst. He highlighted repeated trendline breaks and successful retests of former resistance as support—patterns he views as precursors to sustained upward movement. Establishing and holding support in the current zone remains essential, he said, adding that price acceptance above the 0.618 retracement and weekly Ichimoku cloud would signal a transition from distribution to accumulation.
Wider Crypto Market Shows Improvement
The analyst linked Dogecoin's technical setup to improving conditions across cryptocurrency markets. Bitcoin reclaimed a key level after testing its 20-week moving average and closed above a horizontal level on his daily Gann framework, shifting his near-term outlook higher "as long as price is about 112,000."
Ethereum broke through the 0.86 level "finally this cycle" and successfully retested the breakout—a formation he does not consider bearish. He also cited the OTHERS index, which tracks total crypto market capitalization excluding the top 10 assets, breaking above the weekly Ichimoku cloud and retesting it with the Tenkan indicator rising.
Those signals "probably [are] going to push the cryptocurrency market cap higher," according to the analyst.
Recent price candles hint at potential continuation patterns forming across the sector.
The combination of factors creates what Cantonese Cat described as a coiled spring for Dogecoin. A series of downtrend breaks on thinning volume, persistent higher-timeframe resistance that has absorbed multiple tests, and an increasingly supportive market backdrop all point to potential upside. The catalyst may not require dramatic changes in broader market liquidity—"just a little bit of volume" could trigger a sharp repricing if selling pressure has dried up and momentum thresholds break.
Key Terms Explained
Fibonacci retracement levels are technical analysis tools traders use to identify potential support and resistance levels based on mathematical ratios. The 0.618 level represents a key retracement point where prices often encounter resistance during pullbacks. The Ichimoku cloud is a technical indicator that shows support and resistance levels, momentum and trend direction through multiple moving averages plotted on a chart.
Volume refers to the number of units traded during a given period and serves as a measure of market participation and conviction. Declining volume during a downtrend suggests weakening selling pressure, while increasing volume during an uptrend indicates strengthening buying interest.
Closing Thoughts
Cantonese Cat maintained a bullish stance on Dogecoin contingent on the cryptocurrency holding current support levels. If the memecoin attracts incremental buying volume and converts key resistance levels into support, the analyst expects the next phase could unfold rapidly—a pattern consistent with Dogecoin's historical rally behavior when technical resistance finally breaks.