


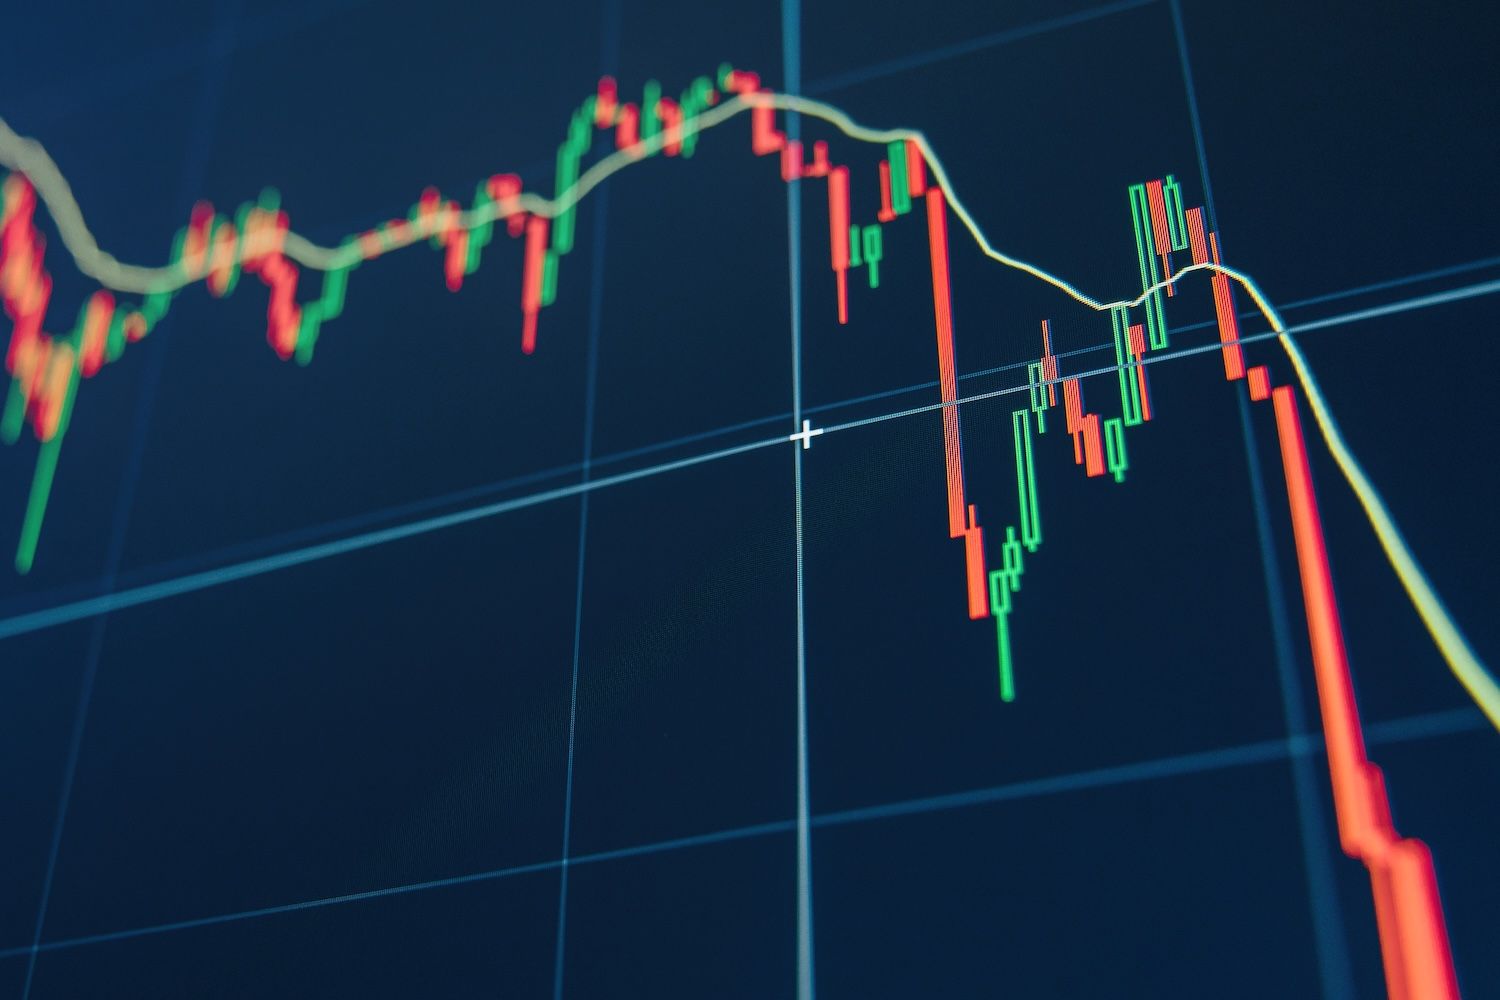
Hyperliquid's native token plunged 18% in a single day, dropping the cryptocurrency out of the top 20 digital assets by market capitalization as November's market downturn intensifies. The token now trades around $33 with a market capitalization near $9 billion, a significant retreat from its September peak above $58 and its brief foray near $16 billion in valuation just months ago.
What to Know:
- Hyperliquid (HYPE) has fallen below the top 20 cryptocurrencies by market cap after an 18% single-day decline, now valued at approximately $9 billion
- Technical analyst Ali Martinez identified a bearish head and shoulders pattern suggesting a potential additional 25% decline to the $25 level
- The token's Relative Strength Index sits at 17, indicating oversold conditions that historically precede short-term price recoveries
Technical Patterns Point to Further Weakness
Analyst Ali Martinez flagged a head and shoulders formation on Hyperliquid's price chart, a technical pattern typically associated with trend reversals.
The formation's head corresponds to the September all-time high above $58. Martinez's analysis suggests the token could decline another 25% from current levels, potentially reaching $25.
Other market watchers share similar bearish outlooks. Trader Mr B projects Hyperliquid will trade within a $20 to $30 range by early January, noting such losses could materialize before year-end. Earlier in November, analyst Crypto Chase described the $25 to $28 zone as "an area of interest for the long term," suggesting accumulation plans if prices reach those depths.
Oversold Indicator Signals Potential Reversal
Despite widespread pessimism, Hyperliquid's Relative Strength Index presents a contrarian signal. The momentum oscillator currently reads 17, well below the 30 threshold that typically indicates oversold conditions. The RSI measures price movement velocity on a scale from 0 to 100, with readings below 30 suggesting potential for near-term gains and readings above 70 indicating overbought conditions that often precede declines.
The decentralized exchange's token reached its $16 billion market capitalization peak several months ago, positioning it near the top 10 cryptocurrencies. The current $9 billion valuation represents a substantial contraction from those highs. November's broader cryptocurrency market weakness has affected numerous digital assets, though Hyperliquid ranks among the hardest hit during the latest selloff.
Understanding Key Terms
The head and shoulders pattern represents a chart formation where prices create three peaks, with the middle peak—the head—rising higher than the two surrounding peaks, or shoulders. Technical analysts view this pattern as indicating exhaustion of upward momentum. The Relative Strength Index functions as a momentum indicator that helps traders identify whether an asset has moved too far, too fast in either direction, potentially signaling reversal points.
Closing Thoughts
Hyperliquid faces continued pressure as technical indicators and analyst forecasts converge on further downside potential. However, the severely oversold RSI reading suggests the token may be approaching a level where short-term buyers could emerge, at least temporarily halting the decline.