


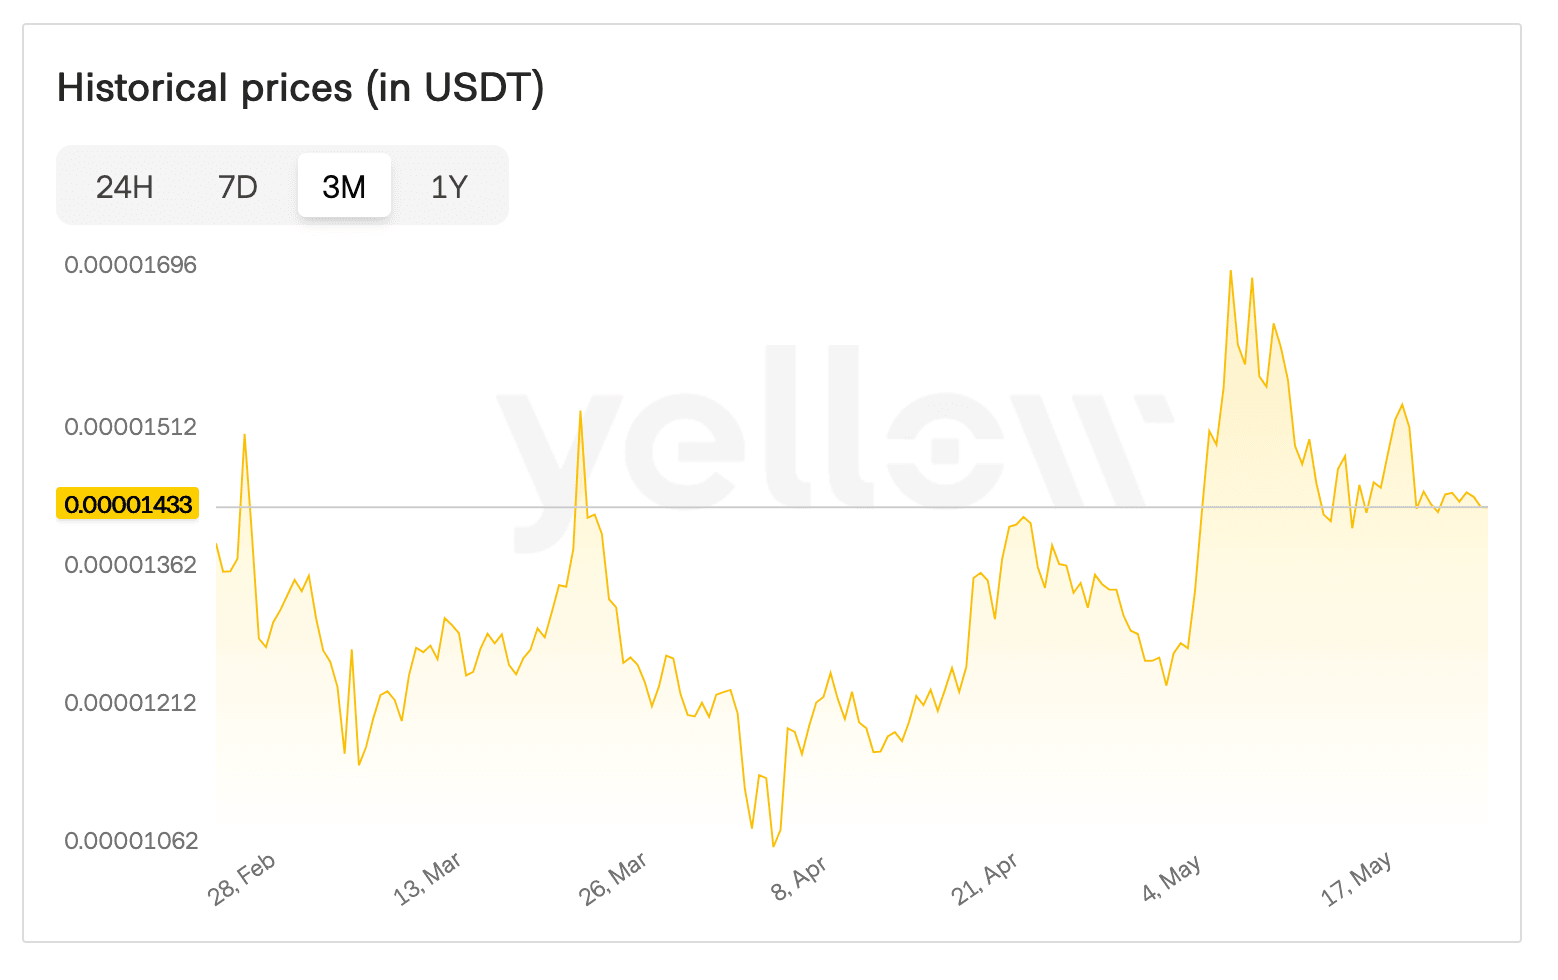
[Shiba Inu}(https://yellow.com/asset/shib) cryptocurrency has formed a triangle consolidation pattern on its 4-hour trading chart that could trigger a 17% price movement in either direction, according to technical analyst Ali Martinez. The memecoin currently trades at $0.00001436, positioned near the midpoint of converging trend lines that have contained its price action over recent weeks.
What to Know:
- Shiba Inu is consolidating within a descending triangle pattern that typically signals continued downward pressure
- The triangle formation suggests a potential 17% price swing once the pattern breaks in either direction
- Current trading price sits at $0.00001436, down 2% over the past seven days
Triangle Pattern Formation Signals Imminent Breakout
Martinez identified the triangle pattern in a recent social media post, noting how SHIB's price has moved between two converging trend lines. Triangle patterns in technical analysis emerge when asset prices consolidate between support and resistance levels that gradually narrow toward a convergence point.
The upper trend line typically acts as resistance while the lower line provides support. Three main triangle variations exist in technical analysis: ascending, descending, and symmetrical patterns. Each type depends on how the trend lines are arranged relative to each other.
Ascending triangles form when the upper line remains flat while the lower line slopes upward, indicating net bullish consolidation. Descending triangles show the opposite arrangement. Symmetrical triangles feature both lines angled at equal but opposite slopes, creating sideways consolidation that narrows to a point.
Descending Pattern Suggests Bearish Continuation
The chart shared by Martinez reveals Shiba Inu has been trading within a descending triangle formation. This pattern type generally indicates bearish continuation, though it can occasionally signal trend reversal with an upward breakout instead.
Triangle breakouts often produce price moves roughly equal to the pattern's height - the distance between upper and lower trend lines at their widest point. This measurement principle supports Martinez's 17% swing projection for SHIB.
Current price action places Shiba Inu near the triangle's center point between both trend lines. The narrowing consolidation pattern means a definitive break from either resistance or support levels appears increasingly likely as the formation tightens.
Market Timing and Price Outlook
Descending triangles typically function as continuation patterns during established downtrends. However, these formations can sometimes produce surprise reversals when buyers overwhelm selling pressure near support levels.
SHIB's recent 2% decline over seven trading days reflects the broader consolidation phase. The cryptocurrency's position between key technical levels leaves both bullish and bearish scenarios possible depending on which trend line breaks first.
As consolidation continues, the triangular channel grows tighter with each trading session. This compression effect often precedes significant price movements as traders position for the eventual breakout direction.
Closing Thoughts
Technical analysis suggests Shiba Inu cryptocurrency stands at a critical juncture within its descending triangle pattern, with a potential 17% price movement awaiting resolution of the current consolidation phase. The pattern's outcome will likely determine SHIB's near-term directional bias as the formation approaches its apex.