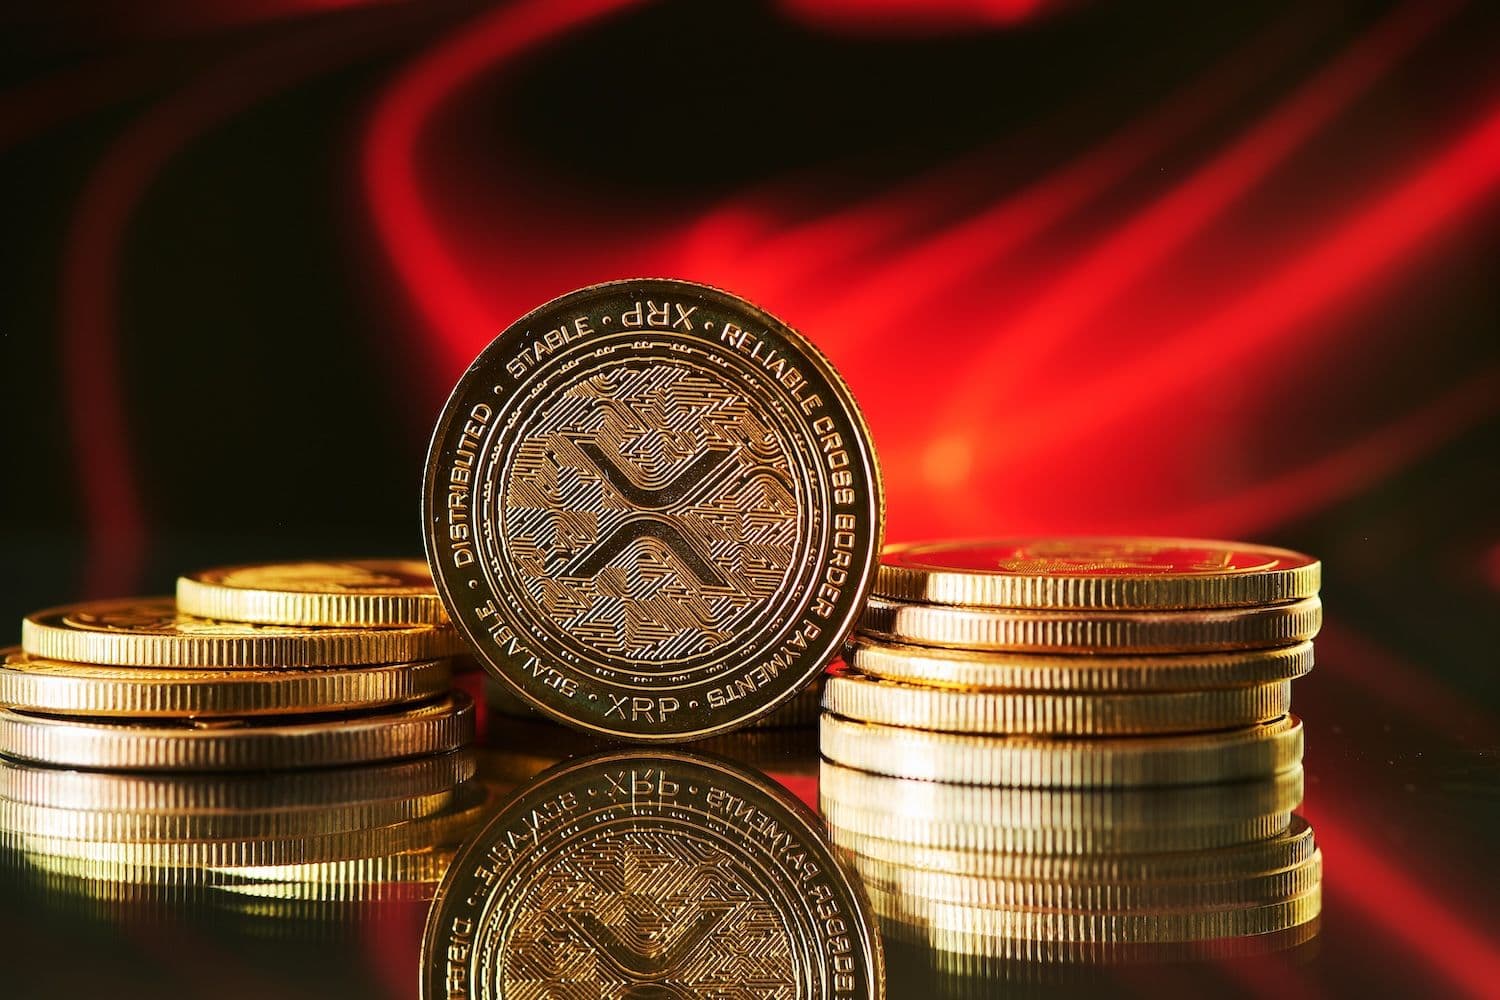
XRP (XRP) is trading at $1.42 and sitting below a descending trendline that has rejected price advances three times since January, but on-chain metrics tracked by Glassnode show the token entering a zone that preceded a 51% rally in Jul. 2024.
What Happened: On-Chain Signals Flash
The Market Value to Realized Value indicator, known as MVRV, has remained below the 1.0 threshold for an extended period. A reading under 1.0 typically suggests the asset is undervalued relative to its historical cost basis — a condition often tied to capitulation among short-term holders.
Green bars in the MVRV model indicate XRP is in a "getting low" range, pointing to a potential bottom.
Historically, such readings appeared after the ratio stayed below 1.0 for roughly 15% of trading days, and those periods aligned with reversals rather than extended sell-offs.
A comparable setup emerged in Jul. 2024, when XRP surged 51% within days of similar MVRV readings. Separately, the number of addresses holding at least 10,000 XRP has begun to stabilize after its steepest decline since Dec. 2020, suggesting mid-sized holders are returning after a wave of accumulation by larger investors.
The token holds above its critical $1.36 support level, but a breakout above $1.57 would be needed to confirm a trend reversal and potentially open a path toward $1.91. A breakdown below $1.36 would shift the structure bearish, with downside risk extending toward $1.11.
Also Read: Ex-Coinbase CTO Calls Zcash Key Weapon To Fight AI Surveillance
Why It Matters: Historical Pattern Recurrence
Past performance does not guarantee future results. But the convergence of a sub-1.0 MVRV reading, stabilizing holder counts and a triple-tested resistance line mirrors conditions that have preceded recoveries in XRP's trading history.
The Jul. 2024 precedent is the most direct comparison — a nearly identical technical setup that resulted in a sharp short-term rally.
Rising participation from mid-sized holders, which Glassnode data shows typically follows accumulation by larger investors, suggests a cascading improvement in confidence that often signals broader sentiment shifts.
Whether XRP breaks through its 2026 downtrend or continues consolidating depends on whether these historical tendencies hold. Traders are watching the $1.57 level as the key confirmation point.
Read Next: Can Ethereum Break Through Bearish Trend Line Blocking $2K Path?