


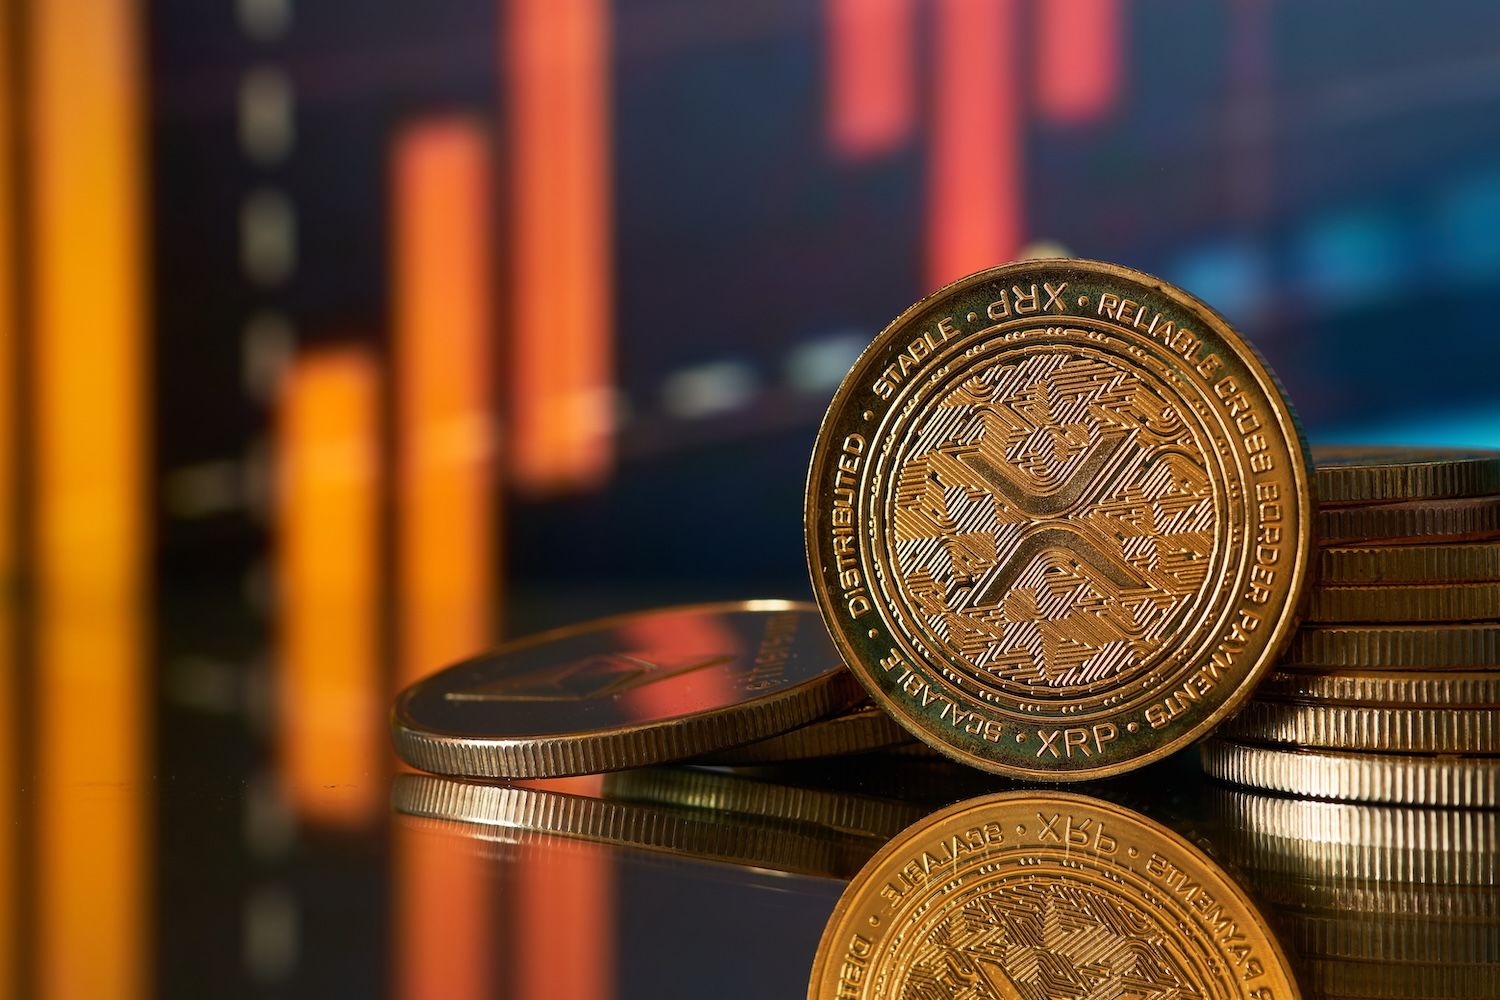
XRP (XRP) has fallen roughly 15% over the past week and 33% in the last 30 days to trade at $1.37, but analyst Arthur argues that a nine-year ascending channel on the monthly chart points to a key support zone at $0.85–$0.95 where institutional capital could re-enter the market.
What Happened: Monthly Chart Flags Support
Arthur posted a detailed thread on X, mapping XRP price action from Mar. 2017 to the present on the monthly timeframe. The lower boundary of an ascending channel, tested repeatedly over nine years, now sits roughly 30% below current prices.
"The bottom of the monthly channel may very well represent the area where 'smart money' returns," Arthur wrote. He noted that the largest volume spike in XRP history occurred between November 2020 and April 2021, while the 2024 rally above $2 saw four times less volume.
"The real money hasn't returned yet," he said. "What we saw in 2024 was whales and some funds. Not the large institutional flow that changes a market forever."
Derivatives data from Arab Chain showed that over the past 30 days, XRP futures open interest dropped by about 1.8 billion XRP on Bybit, 1.6 billion on Binance and 1.5 billion on Kraken. The contraction suggests traders are closing leveraged positions rather than building new ones.
Also Read: Ethereum Stalls Below $2,050 As Bears Tighten Grip
Why It Matters: Macro Shift Builds Case
Arthur cited five macro developments distinguishing early 2026 from prior cycles, including regulatory clarity after the conclusion of Ripple's SEC lawsuit, the launch and scaling of RLUSD, and institutional integration of Ripple's technology. He also pointed to the accelerating tokenization narrative and what he called "real institutional infrastructure" now in place.
"Technical analysis is always driven by macro," he said.
"And the macro is pointing up." XRP has a history of sharp recoveries — it traded near $0.30 for months during the 2018 bear market before rallying to $1.70 in April 2021, then bottomed around $0.35 in spring 2022 and remained range-bound until November 2024, when it climbed above $2 and later hit an all-time high of $3.65 in Jul. 2025.
Read Next: Third-Largest Bitcoin Miner Sells 4,451 BTC Marking Pivot To AI