


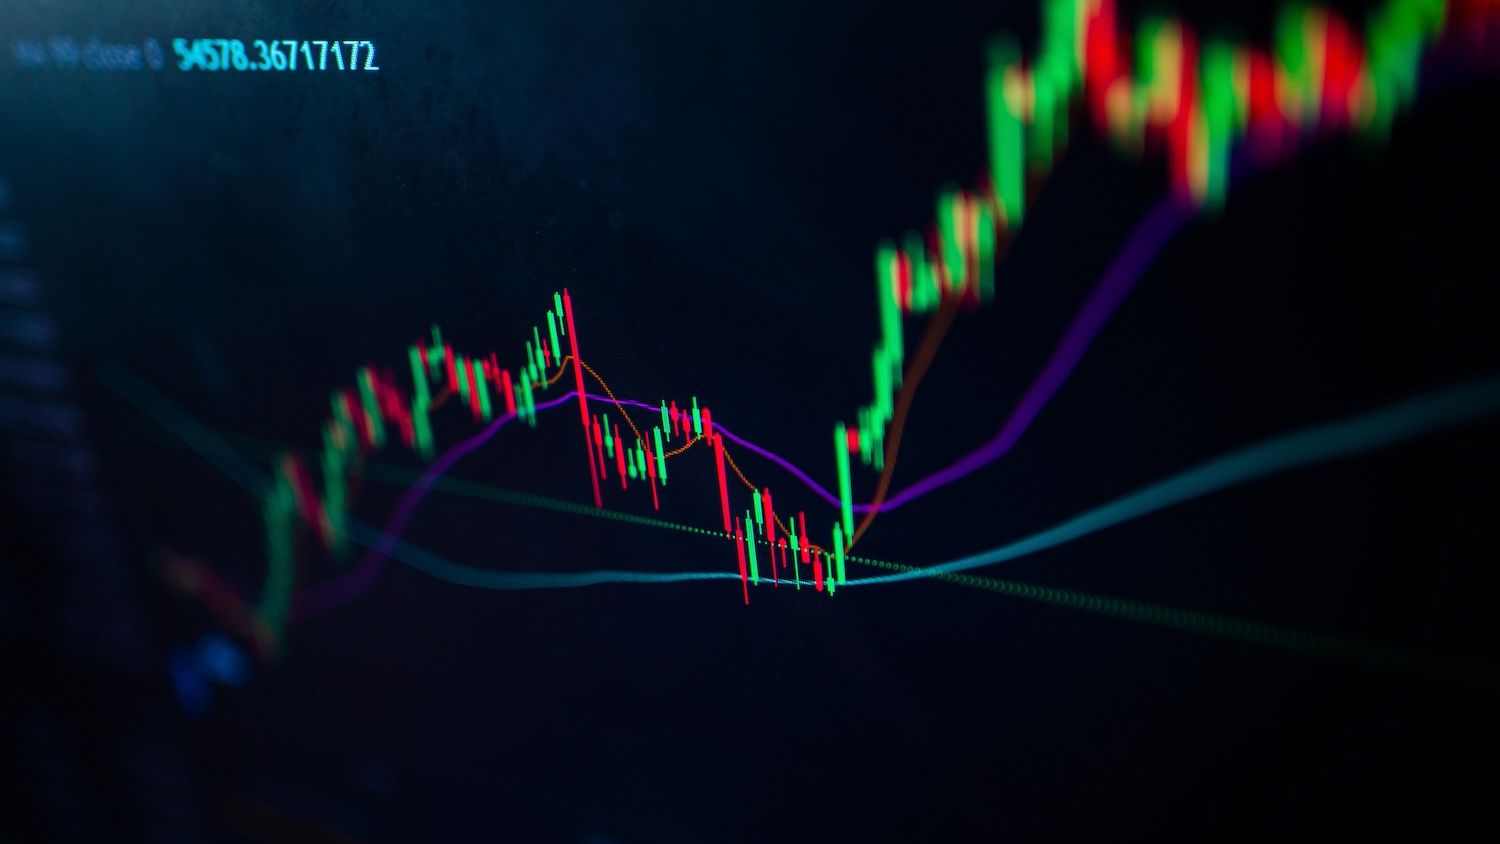
XRP cryptocurrency traded within a narrow 2% range between $2.81 and $2.87 during Tuesday's 24-hour session, forming a symmetrical triangle pattern that has captured trader attention as the token approaches a potential breakout above the $3.00 psychological level.
What to Know:
- Large wallet holders accumulated approximately 340 million XRP tokens worth roughly $960 million over the past two weeks, even as institutional investors liquidated around $1.9 billion since July
- Total transaction volume across the XRP Ledger reached 2.15 billion tokens on September 1, more than double the typical daily activity levels
- Technical analysts remain divided on outlook, with some targeting $7-$13 upside while others warn of fading momentum below multi-year resistance levels
Mixed Institutional Flows Create Market Tension
The cryptocurrency opened near $2.84 and closed marginally higher at $2.85 despite experiencing notable intraday volatility. Price action dipped from the opening level of $2.84 down to $2.79 in early trading before rebounding to reach $2.87 by midday on September 3.
Support emerged consistently at the $2.82 level, repeatedly attracting buying interest from market participants. Resistance remained firm near $2.86, where distribution pressure intensified and capped upward moves. The session's final hour witnessed a notable reversal pattern when a spike to $2.873 at 12:38 GMT on volume of 5.38 million tokens was quickly rejected, pushing the price back below the $2.85 mark.
The contrasting institutional flows have created an unusual dynamic in XRP markets. While large wallet addresses have been accumulating tokens aggressively, traditional institutional investors have maintained their selling pressure that began in July. This divergence suggests differing perspectives on the token's near-term prospects among sophisticated market participants.
Technical Indicators Point to Potential Breakout Setup
From a technical analysis perspective, the $2.82 zone continues to function as the primary demand area for XRP. Should this support level fail, analysts identify $2.70 and $2.50 as the next significant downside targets.
On the upside, the $2.86-$2.88 range persists as overhead supply resistance. The $3.00 level represents a crucial psychological hurdle for bulls, with $3.30 serving as the key breakout confirmation level that could unlock higher price targets.
Momentum indicators present a mixed but cautiously optimistic picture.
The Relative Strength Index remains steady in the mid-50s range, indicating a neutral bias with a slight bullish lean. The MACD histogram shows convergence toward a potential bullish crossover, suggesting momentum could strengthen if trading volume continues at elevated levels.
The symmetrical triangle consolidation pattern beneath the $3.00 level remains intact according to chart analysis. A decisive break above the $3.30 resistance could trigger the next significant upward move, while failure to hold current support levels might lead to deeper retracement.
Market Participants Monitor Key Levels and External Factors
Trading volumes during recent sessions have shown significant increases, with 93-95 million tokens changing hands compared to the typical average of 44 million tokens. These volume surges indicate active participation from institutional-sized market participants and suggest heightened interest in XRP at current price levels.
Traders are closely monitoring several key factors that could influence near-term price direction.
The ability of the $2.82 support level to withstand renewed selling pressure remains paramount. A decisive close above the $2.86-$2.88 resistance zone, followed by a break of $3.00 and ultimately $3.30, would establish a bullish breakout scenario.
The ongoing whale accumulation versus continued institutional selling creates an intriguing dynamic that market participants are tracking carefully. Additionally, regulatory developments and macroeconomic catalysts, including Federal Reserve policy decisions and potential SEC clarity regarding cryptocurrency regulations, could rapidly shift market sentiment in either direction.
Understanding Key Cryptocurrency Terms
For readers unfamiliar with digital asset markets, several terms merit explanation. "Whales" refers to large holders who possess significant amounts of a particular cryptocurrency, typically enough to influence price movements. The "XRP Ledger" represents the decentralized blockchain network on which XRP transactions are processed and recorded.
A "symmetrical triangle" pattern in technical analysis occurs when price movements create converging trend lines, often preceding significant breakouts in either direction. "Volume" measures the total number of tokens traded during a specific time period, with higher volume generally indicating increased market interest and participation.
The Relative Strength Index (RSI) and Moving Average Convergence Divergence (MACD) are momentum oscillators that traders use to identify potential buy and sell signals. These indicators help assess whether an asset is overbought, oversold, or experiencing shifting momentum trends.
Closing Thoughts
XRP's current consolidation below $3.00 reflects a market in transition, with whale accumulation offsetting institutional selling pressure. The formation of a symmetrical triangle pattern suggests a significant price movement may be approaching, with the $3.30 level serving as the critical breakout threshold that could determine the token's next directional move.