


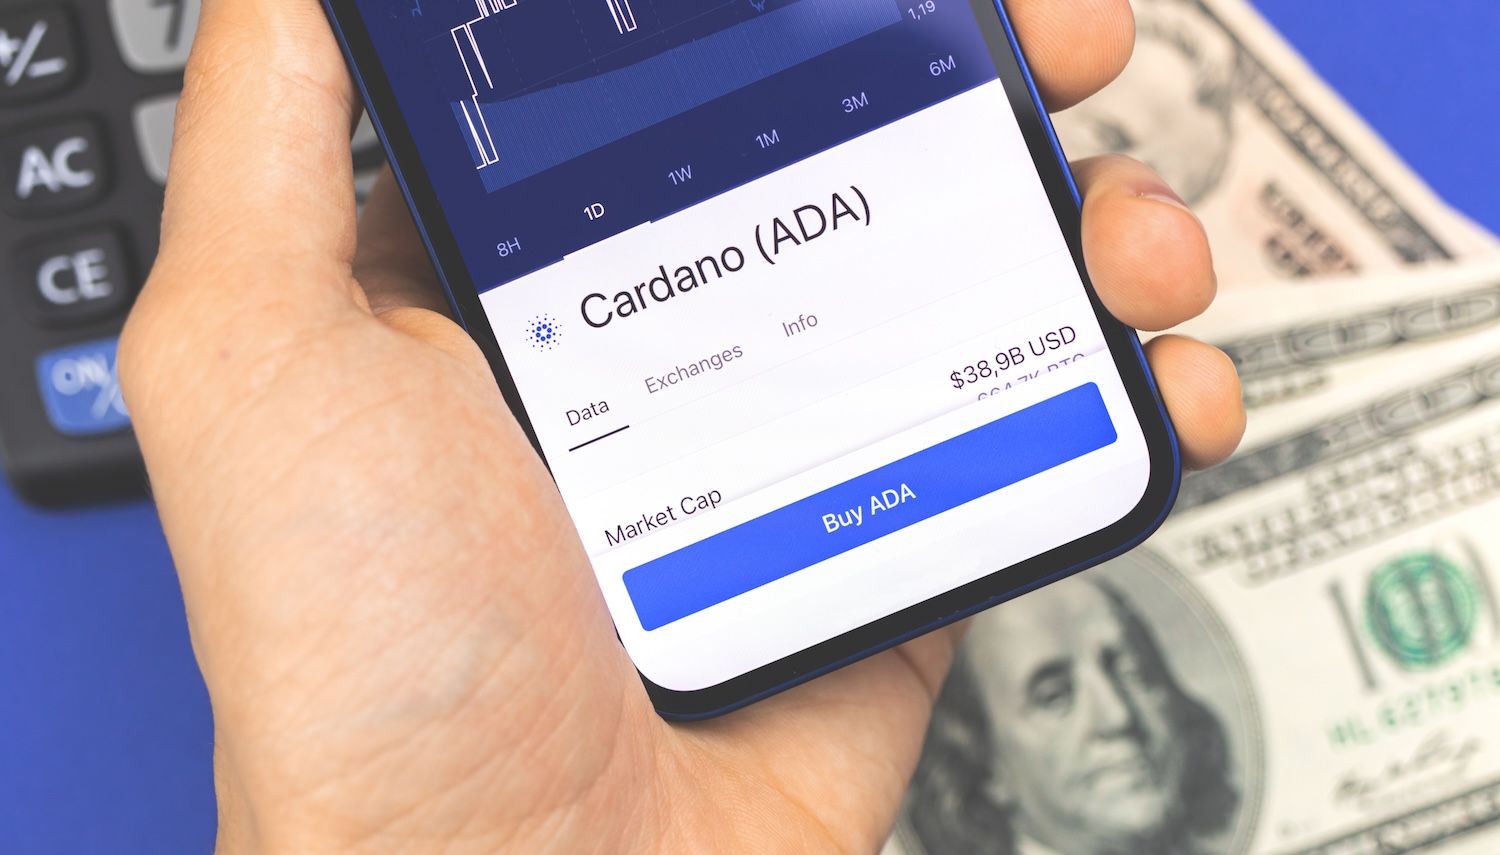
Cardano's native token ADA has entered a fresh decline, falling below the critical $0.850 support zone and consolidating near $0.80 levels. The cryptocurrency now faces additional selling pressure as technical indicators suggest potential for further downward movement, with bears testing key support areas that could determine the token's near-term direction.
What to Know:
- ADA has broken below the $0.850 support level and formed a low at $0.8003, with price now trading below the 100-hourly moving average
- Technical analysis reveals a bearish trend line with resistance at $0.820, while MACD shows gaining momentum in bearish territory
- Key support levels at $0.80 and $0.780 could determine whether ADA continues declining toward $0.750 or stages a recovery above $0.840
Technical Breakdown Shows Weakness
The recent price action began after Cardano encountered resistance near $0.880, mirroring broader cryptocurrency market weakness seen in Bitcoin and Ethereum. ADA subsequently broke through multiple support levels, including $0.850 and $0.8320, before bears pushed the price below the psychologically important $0.820 mark.
The decline reached its lowest point at $0.8003, where some consolidation has occurred. A minor recovery attempt brought the price toward the 23.6% Fibonacci retracement level of the recent decline from the $0.8376 swing high to the $0.8003 low. However, this bounce has proven insufficient to restore bullish momentum.
Current trading activity shows ADA positioned below both the $0.820 level and the 100-hourly simple moving average. The formation of a bearish trend line adds additional resistance at the $0.820 level, creating a technical barrier that must be overcome for any meaningful recovery attempt.
Resistance Levels Define Recovery Path
For ADA to mount a sustained rally, the cryptocurrency must first clear the immediate resistance zone near $0.820. The primary resistance level sits at approximately $0.8280, which corresponds to the 76.4% Fibonacci retracement level of the recent decline from $0.8376 to $0.8003.
Should ADA manage to break above this initial resistance, the next significant hurdle appears at $0.840. A decisive close above the $0.840 resistance level could trigger a stronger rally, potentially driving the price toward the $0.8620 region.
Further gains beyond this level might target the previous resistance area near $0.880.
The path higher requires sustained buying interest and a shift in market sentiment. Without such support, ADA remains vulnerable to additional selling pressure.
Support Levels Under Scrutiny
If Cardano fails to reclaim the $0.840 resistance level, another decline appears likely. The immediate support zone rests near the $0.80 level, which has already been tested during recent trading sessions.
Below this level, the next major support emerges at $0.780. A breakdown below $0.780 would open the possibility of a test of $0.7620, representing a more significant decline from current levels. The final major support level identified in the analysis sits near $0.750, where long-term holders and institutional buyers might provide buying support.
These support levels represent critical areas where the cryptocurrency's trajectory could be determined. A failure to hold above $0.780 would signal continued weakness and potentially attract additional selling interest.
Understanding Key Technical Terms
Several technical indicators and concepts are central to analyzing Cardano's current price action. The Moving Average Convergence Divergence (MACD) is a momentum indicator that tracks the relationship between two moving averages of a security's price. When MACD gains momentum in the bearish zone, it suggests selling pressure is increasing.
The Relative Strength Index (RSI) measures the speed and change of price movements on a scale of 0 to 100. An RSI below 50 typically indicates bearish momentum, while readings above 50 suggest bullish conditions.
Fibonacci retracement levels are horizontal lines that indicate areas of support or resistance at key Fibonacci levels before the price continues in the original direction. These levels are commonly used to identify potential reversal points during market corrections.
Current Technical Indicators Paint Bearish Picture
Technical analysis reveals concerning signals for ADA's near-term prospects. The hourly MACD indicator shows gaining momentum in the bearish zone, suggesting that selling pressure continues to build. This momentum indicator often provides early signals of trend changes and current readings support the bearish outlook.
The hourly RSI has fallen below the 50 level, confirming the bearish momentum identified by the MACD. When RSI readings drop below this midpoint, it typically indicates that selling pressure outweighs buying interest. Major support levels have been established at $0.8000 and $0.7800, while resistance levels remain at $0.8200 and $0.8400. These levels will likely determine ADA's direction in the coming trading sessions.
Closing Thoughts
Cardano faces significant technical challenges as ADA trades below key support levels and encounters resistance at $0.820. The combination of bearish technical indicators and established resistance levels suggests continued pressure on the cryptocurrency. While support levels at $0.80 and $0.780 may provide temporary stability, a clear break above $0.840 appears necessary for any sustained recovery attempt.