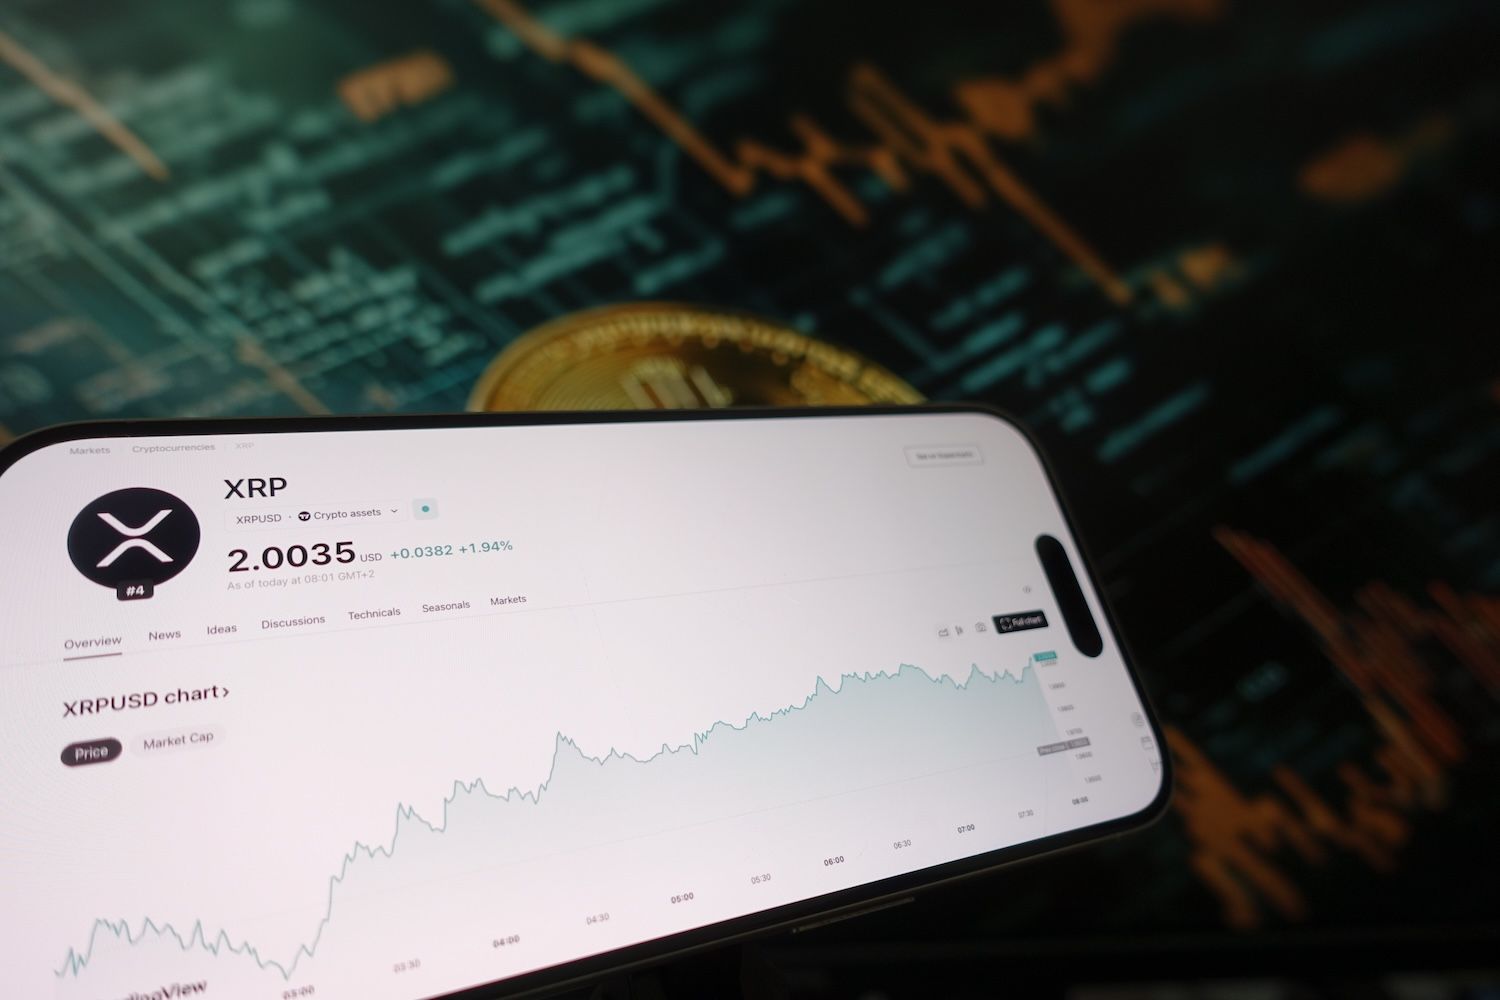
XRP climbed back above $2.00 after falling to $1.8177, with technical indicators suggesting a potential continuation of the recovery if the cryptocurrency can break through resistance at $2.150. The digital asset broke above a bearish trend line and now trades above its 100-hourly simple moving average, though analysts warn a failure to clear key resistance levels could trigger another decline toward $1.80.
Key Facts:
- XRP bottomed at $1.8177 before recovering above $2.00, breaking through a bearish trend line that had kept prices under pressure
- The cryptocurrency now trades above the 76.4% Fibonacci retracement level, with technical indicators including MACD and RSI showing bullish momentum
- Resistance at $2.150 represents the critical test for bulls, with failure potentially sending prices back toward $1.880 or lower
What Happened: Technical Breakout
XRP extended its losses below the $2.00 support level, following broader weakness in Bitcoin and Ethereum. The cryptocurrency spiked below $1.90 before buyers stepped in, establishing a low at $1.8177.
The subsequent recovery pushed XRP above $1.88 and $1.95, clearing the 50% Fibonacci retracement level of the downward move from $2.140 to $1.817, according to data from Kraken.
Bulls broke through a bearish trend line that had capped rallies at $2.00 on the hourly chart of the XRP/USD pair.
The price now trades above the 76.4% Fibonacci retracement level of that same decline.
Hourly technical indicators support the recovery. The MACD for XRP/USD is gaining momentum in bullish territory. The Relative Strength Index has climbed above 50.
Why It Matters: Pivotal Levels
The $2.150 level represents the first major resistance that could determine whether XRP's recovery continues or stalls. A close above that threshold could open the path toward $2.20, with subsequent resistance points at $2.250, $2.320, $2.350, and $2.40.
Initial resistance sits near $2.120. Traders are watching whether XRP can sustain trading above its 100-hourly simple moving average, which has provided support during the recent bounce.
Should XRP fail to clear $2.150, support levels come into focus at $2.00 and $1.980. A break below $1.980 could accelerate selling toward $1.880, with major support at $1.8450. Further downside pressure could push the cryptocurrency toward $1.80.
The Bottom Line
XRP's recovery from $1.8177 has brought the cryptocurrency back above $2.00 and key technical levels, but the test at $2.150 resistance will determine whether bulls can extend gains or if another decline materializes. The current positioning above the 100-hourly simple moving average and improving momentum indicators suggest buyers remain engaged, though resistance overhead could limit near-term upside.